Analytical Skills Job Trends in the North of England

Analytical Skills
England > North of England

The table below looks at the prevalence of the term Analytical Skills in permanent job vacancies in the North of England. Included is a benchmarking guide to the salaries offered in vacancies that cited Analytical Skills over the 6 months leading up to 25 October 2025, comparing them to the same period in the previous two years.

6 months to
25 Oct 2025
Same period 2024 Same period 2023
Rank 7 18 23
Rank change year-on-year +11 +5 +3
Permanent jobs citing Analytical Skills 1,155 921 714
As % of all permanent jobs in the North of England 12.66% 7.31% 8.82%
As % of the General category 20.54% 12.66% 13.69%
Number of salaries quoted 345 412 520
10th Percentile £28,228 £30,000 £26,413
25th Percentile £33,125 £39,375 £37,885
Median annual salary (50th Percentile) £45,000 £50,000 £50,000
Median % change year-on-year -10.00% - +5.26%
75th Percentile £60,000 £63,750 £65,750
90th Percentile £73,750 £71,991 £72,500
England median annual salary £50,000 £55,000 £57,000
% change year-on-year -9.09% -3.51% +3.64%

All General Skills
North of England

Analytical Skills falls under the General Skills category. For comparison with the information above, the following table provides summary statistics for all permanent job vacancies requiring common skills in the North of England.

Permanent vacancies with a requirement for common skills 5,623 7,273 5,217
As % of all permanent jobs advertised in the North of England 61.62% 57.71% 64.45%
Number of salaries quoted 2,757 3,072 3,886
10th Percentile £26,000 £29,775 £27,750
25th Percentile £30,500 £36,750 £37,750
Median annual salary (50th Percentile) £45,000 £50,000 £51,500
Median % change year-on-year -10.00% -2.91% -0.59%
75th Percentile £62,125 £63,900 £67,500
90th Percentile £78,750 £77,500 £82,548
England median annual salary £52,500 £60,000 £60,000
% change year-on-year -12.50% - -

Analytical Skills
Job Vacancy Trend in the North of England

Historical trend showing the proportion of permanent IT job postings citing Analytical Skills relative to all permanent IT jobs advertised in the North of England.
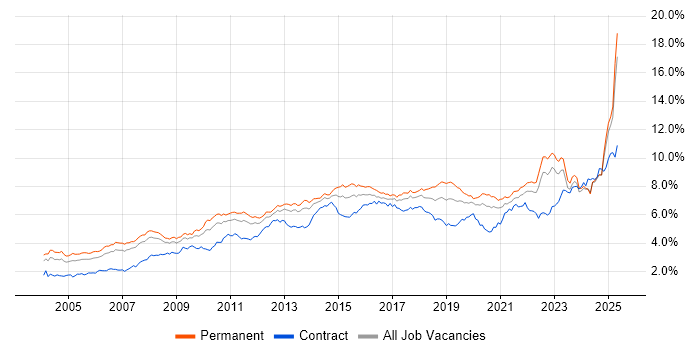
Analytical Skills job vacancy trend in the North of England

Analytical Skills
Salary Trend in the North of England

Salary distribution trend for jobs in the North of England citing Analytical Skills.

Salary distribution trend for jobs in the North of England citing Analytical Skills

Analytical Skills
Salary Histogram in the North of England

Salary distribution for jobs citing Analytical Skills in the North of England over the 6 months to 25 October 2025.

Salary histogram for Analytical Skills in the North of England

Analytical Skills
Job Locations in the North of England

The table below looks at the demand and provides a guide to the median salaries quoted in IT jobs citing Analytical Skills within the North of England region over the 6 months to 25 October 2025. The 'Rank Change' column provides an indication of the change in demand within each location based on the same 6 month period last year.

Location Rank Change
on Same Period
Last Year
Matching
Permanent
IT Job Ads
Median Salary
Past 6 Months
Median Salary
% Change
on Same Period
Last Year
Live
Jobs
North West +7 714 £45,000 -10.00% 429
Yorkshire +10 340 £40,000 -23.81% 209
North East +15 101 £40,500 -3.05% 91
Analytical Skills
England

Analytical Skills
Co-Occurring Skills & Capabilities in the North of England by Category

The following tables expand on the one above by listing co-occurrences grouped by category. They cover the same employment type, locality and period, with up to 20 co-occurrences shown in each category:

Application Platforms
1 20 (1.73%) SharePoint
2 18 (1.56%) Microsoft Exchange
3 13 (1.13%) Confluence
4 6 (0.52%) Apache
4 6 (0.52%) Apache Spark
5 4 (0.35%) Camunda
5 4 (0.35%) CMS
6 3 (0.26%) Apache Airflow
6 3 (0.26%) SAS
7 2 (0.17%) FactoryTalk
7 2 (0.17%) HCL Notes
7 2 (0.17%) IIS
7 2 (0.17%) nginx
7 2 (0.17%) Oracle SOA Suite
7 2 (0.17%) WinCC
8 1 (0.087%) ArcGIS
8 1 (0.087%) WordPress
Applications
1 313 (27.10%) Chatbot
2 117 (10.13%) Microsoft Excel
3 57 (4.94%) Microsoft Office
4 25 (2.16%) Microsoft PowerPoint
5 12 (1.04%) Microsoft Project
6 9 (0.78%) AutoCAD
7 8 (0.69%) MS Visio
8 6 (0.52%) SOLIDWORKS
8 6 (0.52%) Spreadsheet
9 1 (0.087%) Revit
9 1 (0.087%) Siemens NX
Business Applications
1 9 (0.78%) Shopify
2 8 (0.69%) Dynamics CRM
3 7 (0.61%) NetSuite
4 6 (0.52%) SAP WM
5 3 (0.26%) SAP CO
5 3 (0.26%) SAP FI
5 3 (0.26%) SAP FI/CO
5 3 (0.26%) SAP S/4HANA
6 2 (0.17%) Dynamics NAV
6 2 (0.17%) Oracle BPM
6 2 (0.17%) Primavera
6 2 (0.17%) SAP EWM
6 2 (0.17%) SAP Oil and Gas
7 1 (0.087%) Oracle Applications
7 1 (0.087%) Oracle EBS
7 1 (0.087%) Oracle ERP
7 1 (0.087%) Oracle General Ledger
7 1 (0.087%) Oracle Payables
7 1 (0.087%) SAP ERP
7 1 (0.087%) Teamcenter
Cloud Services
1 64 (5.54%) Power Platform
2 62 (5.37%) Azure
3 53 (4.59%) AWS
4 45 (3.90%) Microsoft 365
5 22 (1.90%) Entra ID
6 18 (1.56%) Microsoft Copilot
6 18 (1.56%) SaaS
7 15 (1.30%) GCP
8 11 (0.95%) Google Analytics
9 10 (0.87%) Microsoft Purview
10 8 (0.69%) Dynamics 365
11 7 (0.61%) GitHub
12 6 (0.52%) Adobe Analytics
12 6 (0.52%) Figma
12 6 (0.52%) Google Sheets
12 6 (0.52%) Snowflake
13 5 (0.43%) dbt
13 5 (0.43%) Google Ads
14 4 (0.35%) AWS CloudFormation
14 4 (0.35%) Serverless
Communications & Networking
1 252 (21.82%) VPN
2 251 (21.73%) Cisco IOS
3 24 (2.08%) Firewall
4 7 (0.61%) DHCP
4 7 (0.61%) DNS
4 7 (0.61%) LAN
4 7 (0.61%) WAN
4 7 (0.61%) Wi-Fi
5 6 (0.52%) Asterisk PBX
5 6 (0.52%) Network Security
5 6 (0.52%) PSTN
5 6 (0.52%) VLAN
5 6 (0.52%) VoIP
6 4 (0.35%) Intranet
6 4 (0.35%) SMS
7 3 (0.26%) Broadband
7 3 (0.26%) Internet
7 3 (0.26%) WPA
8 2 (0.17%) Ethernet
8 2 (0.17%) Intrusion Detection
Database & Business Intelligence
1 62 (5.37%) Power BI
2 42 (3.64%) Tableau
3 23 (1.99%) Data Mining
4 19 (1.65%) SQL Server
5 12 (1.04%) Data Warehouse
6 11 (0.95%) Data Lake
7 10 (0.87%) Amazon Redshift
7 10 (0.87%) Looker
8 9 (0.78%) Relational Database
9 7 (0.61%) GIS
10 6 (0.52%) Metadata
11 5 (0.43%) BigQuery
11 5 (0.43%) BusinessObjects
11 5 (0.43%) SQL Server Reporting Services
12 4 (0.35%) Geospatial Data
12 4 (0.35%) MySQL
13 3 (0.26%) PostgreSQL
13 3 (0.26%) Spatial Data
14 2 (0.17%) Data Mart
14 2 (0.17%) SAP BW
Development Applications
1 17 (1.47%) JIRA
2 8 (0.69%) GitLab
2 8 (0.69%) Jenkins
3 7 (0.61%) Git
4 5 (0.43%) Bitbucket
4 5 (0.43%) SonarQube
4 5 (0.43%) Sonatype Nexus
5 3 (0.26%) Selenium
5 3 (0.26%) WaveMaker
6 2 (0.17%) Cucumber
6 2 (0.17%) Cypress.io
7 1 (0.087%) Appium
7 1 (0.087%) Gatling
7 1 (0.087%) JMeter
7 1 (0.087%) LoadRunner
7 1 (0.087%) Postman
7 1 (0.087%) REST Assured
General
1 346 (29.96%) Social Skills
2 291 (25.19%) Inclusion and Diversity
3 199 (17.23%) Finance
4 57 (4.94%) Manufacturing
5 49 (4.24%) Retail
6 46 (3.98%) Organisational Skills
7 39 (3.38%) Marketing
8 33 (2.86%) Legal
9 25 (2.16%) Banking
10 23 (1.99%) Law
11 20 (1.73%) Influencing Skills
11 20 (1.73%) Presentation Skills
11 20 (1.73%) Public Sector
12 19 (1.65%) Telecoms
13 16 (1.39%) Advertising
14 10 (0.87%) Electronics
15 9 (0.78%) General Ledger
15 9 (0.78%) Local Government
16 7 (0.61%) Pharmaceutical
17 6 (0.52%) Police
Job Titles
1 324 (28.05%) Trainer
2 251 (21.73%) Infrastructure Engineer
3 167 (14.46%) Analyst
4 67 (5.80%) Senior
5 43 (3.72%) Data Analyst
6 39 (3.38%) PLC Engineer
7 29 (2.51%) Support Engineer
8 27 (2.34%) Lead
9 26 (2.25%) Developer
10 25 (2.16%) Lecturer
11 24 (2.08%) Applications Support
11 24 (2.08%) Business Analyst
12 22 (1.90%) Support Analyst
13 20 (1.73%) Financial Analyst
14 18 (1.56%) Trainee
15 16 (1.39%) Senior Analyst
15 16 (1.39%) Trainee Analyst
15 16 (1.39%) Trainee Data Analyst
16 15 (1.30%) IT Support
17 13 (1.13%) Applications Support Analyst
Libraries, Frameworks & Software Standards
1 252 (21.82%) Elastic Stack
2 11 (0.95%) CSS
3 8 (0.69%) React
4 7 (0.61%) REST
5 6 (0.52%) FreeSWITCH
5 6 (0.52%) HTML
5 6 (0.52%) Software Packaging
5 6 (0.52%) Spring
5 6 (0.52%) Spring Boot
5 6 (0.52%) XML
6 5 (0.43%) Flash
6 5 (0.43%) Flutter
6 5 (0.43%) JSON
7 4 (0.35%) .NET
7 4 (0.35%) RESTful
7 4 (0.35%) Web Services
8 3 (0.26%) PySpark
9 2 (0.17%) Kafka
9 2 (0.17%) Laravel
9 2 (0.17%) Pandas
Miscellaneous
1 290 (25.11%) Cyberattack
2 59 (5.11%) Analytical Mindset
3 44 (3.81%) Renewable Energy
4 35 (3.03%) Self-Motivation
5 32 (2.77%) Onboarding
6 28 (2.42%) Driving Licence
6 28 (2.42%) Management Information System
7 25 (2.16%) Social Media
8 13 (1.13%) Robotics
9 11 (0.95%) Data Protection Act
10 10 (0.87%) Data Structures
10 10 (0.87%) Mobile App
10 10 (0.87%) NHS
11 9 (0.78%) Cloud Native
11 9 (0.78%) SCADA
12 8 (0.69%) Life Science
13 6 (0.52%) Product Ownership
14 5 (0.43%) CMDB
14 5 (0.43%) Data Centre
14 5 (0.43%) Foreign Exchange (FX)
Operating Systems
1 286 (24.76%) Windows
2 255 (22.08%) Linux
3 254 (21.99%) Android
4 8 (0.69%) Windows Server
5 5 (0.43%) Mac OS
5 5 (0.43%) Windows Server 2012
5 5 (0.43%) Windows Server 2019
Processes & Methodologies
1 575 (49.78%) Problem-Solving
2 366 (31.69%) AI
3 326 (28.23%) Chemistry
4 313 (27.10%) Conversational UI
5 278 (24.07%) DevOps
6 276 (23.90%) Risk Management
7 272 (23.55%) Task Automation
8 264 (22.86%) Mathematics
9 259 (22.42%) Infrastructure Engineering
10 258 (22.34%) Line Management
11 251 (21.73%) Platform Engineering
11 251 (21.73%) Storage Management
12 118 (10.22%) Decision-Making
13 107 (9.26%) Continuous Improvement
14 101 (8.74%) Agile
15 82 (7.10%) Project Management
16 73 (6.32%) Analytics
16 73 (6.32%) Business Intelligence
17 63 (5.45%) Project Delivery
18 62 (5.37%) Cybersecurity
Programming Languages
1 308 (26.67%) Python
2 264 (22.86%) PowerShell
3 257 (22.25%) Bash
4 109 (9.44%) SQL
5 21 (1.82%) Java
6 9 (0.78%) VBA
7 8 (0.69%) T-SQL
8 5 (0.43%) C#
8 5 (0.43%) JavaScript
8 5 (0.43%) Scala
9 4 (0.35%) Go
9 4 (0.35%) Kotlin
9 4 (0.35%) R
10 3 (0.26%) PHP
11 2 (0.17%) C++
Qualifications
1 476 (41.21%) Degree
2 347 (30.04%) Master's Degree
3 311 (26.93%) PhD
4 40 (3.46%) HND
5 35 (3.03%) DBS Check
6 19 (1.65%) ACCA
6 19 (1.65%) CIMA
7 18 (1.56%) Computer Science Degree
8 13 (1.13%) PMI Certification
9 11 (0.95%) PMP
10 10 (0.87%) BPSS Clearance
11 7 (0.61%) Cisco Certification
11 7 (0.61%) Network+ Certification
11 7 (0.61%) TOGAF Certification
12 6 (0.52%) CCNP
12 6 (0.52%) CompTIA Security+
13 4 (0.35%) HNC
13 4 (0.35%) ITIL Foundation Certificate
13 4 (0.35%) Microsoft Certification
13 4 (0.35%) Security Cleared
Quality Assurance & Compliance
1 36 (3.12%) QA
2 21 (1.82%) Accessibility
3 20 (1.73%) ISO/IEC 27001
4 13 (1.13%) Data Quality
4 13 (1.13%) GDPR
4 13 (1.13%) PMO
5 8 (0.69%) SLA
6 6 (0.52%) California Consumer Privacy Act
6 6 (0.52%) IEC 61131
7 5 (0.43%) GLBA
8 4 (0.35%) ISO 14001
8 4 (0.35%) ISO 9001
8 4 (0.35%) NIST
8 4 (0.35%) SEPA
8 4 (0.35%) TARGET2
9 3 (0.26%) COBIT
9 3 (0.26%) Cyber Essentials
10 2 (0.17%) ITGC
10 2 (0.17%) P3O
10 2 (0.17%) PCI DSS
System Software
1 261 (22.60%) Hyper-V
2 260 (22.51%) Docker
3 251 (21.73%) VMware NSX
3 251 (21.73%) vSphere
4 32 (2.77%) Active Directory
5 6 (0.52%) VMware Infrastructure
6 3 (0.26%) VMware ESXi
Systems Management
1 254 (21.99%) Terraform
2 252 (21.82%) Ansible
3 10 (0.87%) Microsoft Intune
4 5 (0.43%) Grafana
5 4 (0.35%) Kubernetes
6 3 (0.26%) Prometheus
7 2 (0.17%) AssetCenter
7 2 (0.17%) SCCM
8 1 (0.087%) SCOM
8 1 (0.087%) vCenter Server
Vendors
1 311 (26.93%) PayPal
2 263 (22.77%) Cisco
3 255 (22.08%) Splunk
4 252 (21.82%) Juniper
5 251 (21.73%) 3PAR
6 156 (13.51%) Microsoft
7 46 (3.98%) Google
8 31 (2.68%) SAP
9 21 (1.82%) Adobe
10 18 (1.56%) Databricks
11 16 (1.39%) ServiceNow
12 12 (1.04%) Oracle
13 9 (0.78%) Salesforce
13 9 (0.78%) VMware
14 8 (0.69%) HubSpot
15 7 (0.61%) HP
15 7 (0.61%) Workday
16 6 (0.52%) Facebook
16 6 (0.52%) Qualtrics
17 5 (0.43%) RedPrairie