Retail Jobs in the North of England

Retailing
England > North of England

The table below looks at the prevalence of the term Retail in permanent job vacancies advertised in the North of England. Included is a benchmarking guide to the salaries offered in vacancies that have cited Retail over the 6 months to 2 December 2023 with a comparison to the same period over the previous 2 years.

6 months to
2 Dec 2023
Same period 2022 Same period 2021
Rank 31 25 24
Rank change year-on-year -6 -1 +74
Permanent jobs citing Retail 543 1,585 1,383
As % of all permanent jobs advertised in the North of England 6.98% 9.27% 8.25%
As % of the General category 10.58% 14.06% 15.48%
Number of salaries quoted 398 730 563
10th Percentile £26,045 £34,650 £29,163
25th Percentile £35,500 £42,500 £35,000
Median annual salary (50th Percentile) £51,514 £55,000 £45,000
Median % change year-on-year -6.34% +22.22% -5.26%
75th Percentile £72,500 £75,000 £61,250
90th Percentile £87,419 £95,229 £75,000
England median annual salary £57,500 £60,000 £57,500
% change year-on-year -4.17% +4.35% -

All General Skills
North of England

Retail is in the General Skills category. The following table is for comparison with the above and provides summary statistics for all permanent job vacancies advertised in the North of England with a requirement for common skills.

Permanent vacancies with a requirement for common skills 5,133 11,272 8,936
As % of all permanent jobs advertised in the North of England 65.98% 65.95% 53.33%
Number of salaries quoted 3,519 6,039 5,959
10th Percentile £27,750 £28,749 £27,500
25th Percentile £37,797 £38,500 £35,000
Median annual salary (50th Percentile) £52,500 £52,500 £47,500
Median % change year-on-year - +10.53% +4.40%
75th Percentile £69,136 £67,500 £62,500
90th Percentile £84,056 £84,056 £77,500
England median annual salary £60,000 £60,000 £60,000
% change year-on-year - - +4.35%

Retail
Job Vacancy Trend in the North of England

Job postings citing Retail as a proportion of all IT jobs advertised in the North of England.
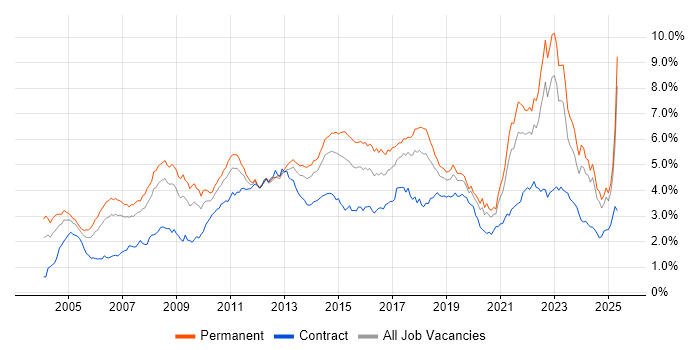
Job vacancy trend for Retail in the North of England

Retail
Salary Trend in the North of England

3-month moving average salary quoted in jobs citing Retail in the North of England.

Salary trend for Retail in the North of England

Retail
Salary Histogram in the North of England

Salary distribution for jobs citing Retail in the North of England over the 6 months to 2 December 2023.

Salary histogram for Retail in the North of England

Retail
Job Locations in the North of England

The table below looks at the demand and provides a guide to the median salaries quoted in IT jobs citing Retail within the North of England region over the 6 months to 2 December 2023. The 'Rank Change' column provides an indication of the change in demand within each location based on the same 6 month period last year.

Location Rank Change
on Same Period
Last Year
Matching
Permanent
IT Job Ads
Median Salary
Past 6 Months
Median Salary
% Change
on Same Period
Last Year
Live
Jobs
Yorkshire -12 279 £51,528 -6.31% 169
North West -12 226 £55,000 +4.76% 257
North East +29 38 £32,313 -53.84% 51
Retail
England

Retail
Co-occurring Skills and Capabilities in the North of England by Category

The follow tables expand on the table above by listing co-occurrences grouped by category. The same employment type, locality and period is covered with up to 20 co-occurrences shown in each of the following categories:

Application Platforms
1 22 (4.05%) SAS
2 19 (3.50%) Confluence
3 14 (2.58%) Apache Spark
4 9 (1.66%) Jetty
4 9 (1.66%) Tomcat
5 7 (1.29%) Apache
6 1 (0.18%) CMS
6 1 (0.18%) ColdFusion
6 1 (0.18%) Drupal
6 1 (0.18%) Moodle
6 1 (0.18%) NetWeaver
6 1 (0.18%) Umbraco
Applications
1 36 (6.63%) Microsoft Excel
2 23 (4.24%) Microsoft Office
3 6 (1.10%) Microsoft PowerPoint
4 3 (0.55%) SPSS
5 2 (0.37%) Spreadsheet
6 1 (0.18%) EViews
6 1 (0.18%) Microsoft Project
6 1 (0.18%) Trello
Business Applications
1 8 (1.47%) SAP S/4HANA
2 7 (1.29%) SAP Retail
3 5 (0.92%) Epicor Tropos
3 5 (0.92%) SAP MDG
4 4 (0.74%) Dynamics NAV
4 4 (0.74%) SAP CO
4 4 (0.74%) SAP FI
4 4 (0.74%) SAP FI/CO
5 3 (0.55%) Dynamics AX
6 2 (0.37%) Magento
6 2 (0.37%) NetSuite
7 1 (0.18%) Dynamics CRM
7 1 (0.18%) SAP BPC
7 1 (0.18%) SAP ERP
7 1 (0.18%) SAP IBP
7 1 (0.18%) SAP SD
7 1 (0.18%) Shopify
Cloud Services
1 92 (16.94%) Azure
2 76 (14.00%) AWS
3 53 (9.76%) GCP
4 46 (8.47%) SaaS
5 44 (8.10%) Power Platform
6 38 (7.00%) PaaS
7 26 (4.79%) IaaS
8 20 (3.68%) Serverless
9 17 (3.13%) Azure DevOps
10 15 (2.76%) Microsoft 365
11 12 (2.21%) GitHub
12 9 (1.66%) Azure Functions
13 8 (1.47%) Azure Cosmos DB
13 8 (1.47%) Azure Service Bus
13 8 (1.47%) Cloud Computing
13 8 (1.47%) Google Kubernetes Engine
14 7 (1.29%) AWS Direct Connect
15 6 (1.10%) AWS CodePipeline
15 6 (1.10%) Azure ExpressRoute
15 6 (1.10%) Boomi
Communications & Networking
1 28 (5.16%) Firewall
2 13 (2.39%) F5 BIG-IP GTM
2 13 (2.39%) F5 BIG-IP LTM
3 11 (2.03%) Internet
3 11 (2.03%) Wi-Fi
4 10 (1.84%) Broadband
4 10 (1.84%) DNS
5 8 (1.47%) DHCP
6 6 (1.10%) Network Security
6 6 (1.10%) VPN
7 5 (0.92%) Remote Desktop
7 5 (0.92%) TCP/IP
8 3 (0.55%) NGFW
8 3 (0.55%) WAN
9 2 (0.37%) LAN
9 2 (0.37%) SD-WAN
10 1 (0.18%) 2G
10 1 (0.18%) 3GPP
10 1 (0.18%) Bluetooth
10 1 (0.18%) VoIP
Database & Business Intelligence
1 44 (8.10%) Power BI
2 29 (5.34%) SQL Server
3 27 (4.97%) Data Warehouse
3 27 (4.97%) NoSQL
4 26 (4.79%) MySQL
5 24 (4.42%) Data Lake
6 19 (3.50%) Big Data
7 14 (2.58%) Relational Database
8 10 (1.84%) PostgreSQL
8 10 (1.84%) SQL Server Reporting Services
9 9 (1.66%) Hadoop
10 7 (1.29%) RDBMS
11 5 (0.92%) BigQuery
11 5 (0.92%) Data Hub
11 5 (0.92%) SQL Server Integration Services
12 4 (0.74%) Azure SQL Database
13 3 (0.55%) Data Mining
13 3 (0.55%) DB2
13 3 (0.55%) MS Access
13 3 (0.55%) SQL Server Analysis Services
Development Applications
1 47 (8.66%) Git
2 21 (3.87%) JIRA
3 14 (2.58%) Jenkins
4 12 (2.21%) Spinnaker
5 6 (1.10%) SonarQube
6 5 (0.92%) GitLab
7 3 (0.55%) git-flow
8 2 (0.37%) Gitleaks
8 2 (0.37%) GoogleTest
8 2 (0.37%) JUnit
8 2 (0.37%) Maven
8 2 (0.37%) PHPUnit
8 2 (0.37%) Sonatype Nexus
8 2 (0.37%) SpecFlow
9 1 (0.18%) Bitbucket
9 1 (0.18%) CMake
9 1 (0.18%) Eclipse
9 1 (0.18%) Postman
9 1 (0.18%) TestCafe
9 1 (0.18%) Visual Studio
General
1 208 (38.31%) Finance
2 205 (37.75%) Social Skills
3 137 (25.23%) Banking
4 107 (19.71%) Analytical Skills
5 50 (9.21%) Marketing
6 43 (7.92%) Inclusion and Diversity
7 36 (6.63%) Presentation Skills
8 19 (3.50%) Manufacturing
8 19 (3.50%) Retail Banking
9 14 (2.58%) Telecoms
10 13 (2.39%) Local Government
11 12 (2.21%) Back Office
11 12 (2.21%) Games
12 10 (1.84%) Organisational Skills
12 10 (1.84%) Retail Finance
13 9 (1.66%) Legal
14 8 (1.47%) Advertising
14 8 (1.47%) Influencing Skills
15 6 (1.10%) Law
16 5 (0.92%) Automotive
Job Titles
1 111 (20.44%) Senior
2 105 (19.34%) Analyst
3 71 (13.08%) Developer
4 68 (12.52%) Architect
5 63 (11.60%) Lead
6 39 (7.18%) Software Engineer
7 36 (6.63%) Solutions Architect
8 27 (4.97%) Senior Analyst
9 23 (4.24%) Enterprise Architect
10 22 (4.05%) Data Analyst
11 21 (3.87%) Senior Developer
12 20 (3.68%) DevOps Engineer
13 18 (3.31%) Cloud Engineer
13 18 (3.31%) Field Engineer
14 17 (3.13%) IT Manager
15 15 (2.76%) Business Analyst
16 14 (2.58%) Lead Software Engineer
17 13 (2.39%) Cisco Engineer
17 13 (2.39%) Senior Cisco Engineer
17 13 (2.39%) Senior Solutions Architect
Libraries, Frameworks & Software Standards
1 43 (7.92%) .NET
2 33 (6.08%) HTML
3 30 (5.52%) OpenID
3 30 (5.52%) React
4 29 (5.34%) CSS
5 23 (4.24%) Node.js
6 18 (3.31%) RESTful
7 17 (3.13%) jQuery
8 15 (2.76%) .NET Core
9 14 (2.58%) AngularJS
9 14 (2.58%) Web Services
10 13 (2.39%) Spine.js
11 12 (2.21%) JSON
11 12 (2.21%) Next.js
11 12 (2.21%) XML
12 11 (2.03%) Laravel
13 10 (1.84%) Spring
14 9 (1.66%) OAuth
15 8 (1.47%) Jest
15 8 (1.47%) Kafka
Miscellaneous
1 43 (7.92%) Cloud Native
2 38 (7.00%) Product Ownership
3 28 (5.16%) EPoS
4 26 (4.79%) Mainframe
5 24 (4.42%) Public Cloud
6 21 (3.87%) Blockchain
6 21 (3.87%) Credit Risk
7 19 (3.50%) Management Information System
8 16 (2.95%) Analytical Mindset
8 16 (2.95%) Self-Motivation
9 14 (2.58%) Data Centre
10 11 (2.03%) Driving Licence
11 9 (1.66%) Online Banking
12 8 (1.47%) Hybrid Cloud
13 6 (1.10%) Data Protection Act
13 6 (1.10%) Digital Media
13 6 (1.10%) FMCG
13 6 (1.10%) Robotics
14 5 (0.92%) Cyber Threat
14 5 (0.92%) Thin Client
Operating Systems
1 49 (9.02%) Windows
2 31 (5.71%) Linux
3 26 (4.79%) Windows Server
4 25 (4.60%) Unix
5 6 (1.10%) Windows 10
6 4 (0.74%) Android
7 3 (0.55%) Windows Server 2008
8 1 (0.18%) Mac OS
8 1 (0.18%) Windows 8
8 1 (0.18%) Windows XP
Processes & Methodologies
1 239 (44.01%) Agile
2 114 (20.99%) Problem-Solving
3 105 (19.34%) Analytics
4 95 (17.50%) DevOps
5 94 (17.31%) CI/CD
6 79 (14.55%) Microservices
7 67 (12.34%) Mentoring
7 67 (12.34%) Roadmaps
8 56 (10.31%) Risk Management
8 56 (10.31%) Software Engineering
9 54 (9.94%) Customer Service
10 48 (8.84%) Decision-Making
11 47 (8.66%) Cybersecurity
12 45 (8.29%) Business Intelligence
13 41 (7.55%) Customer Experience
13 41 (7.55%) Data Strategy
13 41 (7.55%) Infrastructure as Code
14 40 (7.37%) Technology Strategy
15 39 (7.18%) TDD
16 38 (7.00%) Stakeholder Management
Programming Languages
1 94 (17.31%) SQL
2 73 (13.44%) Python
3 51 (9.39%) JavaScript
4 49 (9.02%) Java
5 36 (6.63%) C#
6 23 (4.24%) TypeScript
7 17 (3.13%) PHP
8 16 (2.95%) PowerShell
9 14 (2.58%) R
10 11 (2.03%) Bash
11 7 (1.29%) T-SQL
12 6 (1.10%) Bicep
12 6 (1.10%) Groovy
13 5 (0.92%) Scala
14 3 (0.55%) ABAP
14 3 (0.55%) C
14 3 (0.55%) Kusto Query Language
15 2 (0.37%) C++
16 1 (0.18%) Shell Script
16 1 (0.18%) VBA
Qualifications
1 52 (9.58%) Degree
2 22 (4.05%) SC Cleared
2 22 (4.05%) Security Cleared
3 10 (1.84%) Master's Degree
3 10 (1.84%) PMI Certification
4 8 (1.47%) AWS Certification
4 8 (1.47%) CISMP
5 7 (1.29%) CISM
6 6 (1.10%) CISSP
6 6 (1.10%) Computer Science Degree
6 6 (1.10%) ITIL Certification
6 6 (1.10%) PMP
7 5 (0.92%) Azure Certification
8 4 (0.74%) MBA
9 3 (0.55%) IIBA
10 2 (0.37%) CEH
10 2 (0.37%) GIAC
10 2 (0.37%) ISTQB
10 2 (0.37%) MRICS
10 2 (0.37%) Numerate Degree
Quality Assurance & Compliance
1 14 (2.58%) IFRS
1 14 (2.58%) QA
2 12 (2.21%) IFRS 9
3 9 (1.66%) SLA
4 8 (1.47%) Actionable Recommendations
4 8 (1.47%) GRC
4 8 (1.47%) ISO/IEC 27001
4 8 (1.47%) PCI DSS
5 7 (1.29%) CRD IV
6 4 (0.74%) ISO/IEC 27005
6 4 (0.74%) PMO
7 3 (0.55%) Data Quality
7 3 (0.55%) GDPR
7 3 (0.55%) NIST
8 2 (0.37%) Accessibility
8 2 (0.37%) NIST 800
9 1 (0.18%) ISO 22301
9 1 (0.18%) WCAG
System Software
1 46 (8.47%) Docker
2 30 (5.52%) Active Directory
3 10 (1.84%) VMware Infrastructure
4 7 (1.29%) Hyper-V
5 6 (1.10%) Virtual Machines
6 5 (0.92%) vSphere
7 4 (0.74%) XenApp
8 2 (0.37%) Firmware
Systems Management
1 74 (13.63%) Kubernetes
2 54 (9.94%) Terraform
3 21 (3.87%) Ansible
4 13 (2.39%) Istio
5 11 (2.03%) SCCM
6 9 (1.66%) SCOM
7 4 (0.74%) Argo
7 4 (0.74%) Failover Clustering
7 4 (0.74%) Microsoft Clustering
8 3 (0.55%) CSIRT
9 2 (0.37%) cPanel
9 2 (0.37%) Microsoft Intune
9 2 (0.37%) Puppet
9 2 (0.37%) Single Sign-On
10 1 (0.18%) FlexNet
10 1 (0.18%) Grafana
10 1 (0.18%) HP Fortify
10 1 (0.18%) Packer
10 1 (0.18%) Salt
10 1 (0.18%) Systems Management Server (SMS)
Vendors
1 93 (17.13%) Microsoft
2 26 (4.79%) Cisco
3 23 (4.24%) SAP
4 18 (3.31%) Salesforce
5 13 (2.39%) CheckPoint
5 13 (2.39%) F5
5 13 (2.39%) Fortinet
5 13 (2.39%) Google
5 13 (2.39%) ServiceNow
6 12 (2.21%) IBM
7 10 (1.84%) BT
7 10 (1.84%) VMware
8 9 (1.66%) Dell
8 9 (1.66%) Oracle
9 7 (1.29%) Databricks
9 7 (1.29%) HP
10 6 (1.10%) Confluent
10 6 (1.10%) Criteo
11 5 (0.92%) DoubleClick
11 5 (0.92%) Epicor