JIRA Job Trends in the North of England

Atlassian JIRA
England > North of England

The table below provides summary statistics and salary benchmarking for jobs advertised in the North of England requiring JIRA skills. It covers permanent job vacancies from the 6 months leading up to 30 October 2025, with comparisons to the same periods in the previous two years.

6 months to
30 Oct 2025
Same period 2024 Same period 2023
Rank 105 120 122
Rank change year-on-year +15 +2 -21
Permanent jobs citing JIRA 267 229 208
As % of all permanent jobs in the North of England 2.85% 1.84% 2.61%
As % of the Development Applications category 46.68% 26.05% 20.00%
Number of salaries quoted 98 88 176
10th Percentile £30,500 £31,925 £34,125
25th Percentile £40,000 £42,124 £41,250
Median annual salary (50th Percentile) £50,000 £55,000 £57,500
Median % change year-on-year -9.09% -4.35% +9.52%
75th Percentile £60,750 £68,750 £73,750
90th Percentile £86,625 £101,250 £91,934
England median annual salary £57,500 £57,500 £60,000
% change year-on-year - -4.17% -

All Development Application Skills
North of England

JIRA falls under the Development Applications category. For comparison with the information above, the following table provides summary statistics for all permanent job vacancies requiring development application skills in the North of England.

Permanent vacancies with a requirement for development application skills 572 879 1,040
As % of all permanent jobs advertised in the North of England 6.11% 7.04% 13.05%
Number of salaries quoted 335 465 865
10th Percentile £28,250 £36,450 £41,250
25th Percentile £40,000 £43,710 £46,306
Median annual salary (50th Percentile) £51,500 £52,500 £57,500
Median % change year-on-year -1.90% -8.70% +4.55%
75th Percentile £65,625 £67,500 £72,500
90th Percentile £77,500 £77,500 £84,056
England median annual salary £60,000 £60,000 £65,000
% change year-on-year - -7.69% -

JIRA
Job Vacancy Trend in the North of England

Historical trend showing the proportion of permanent IT job postings citing JIRA relative to all permanent IT jobs advertised in the North of England.
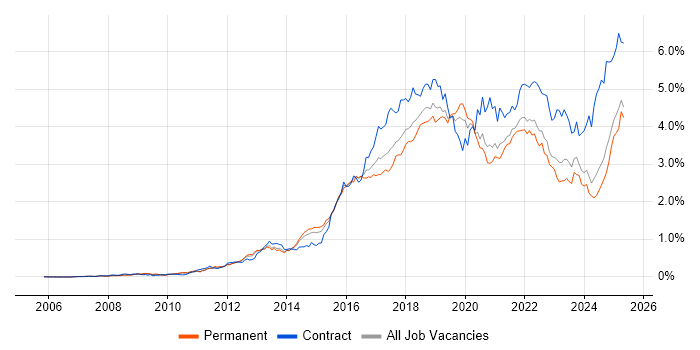
JIRA job vacancy trend in the North of England

JIRA
Salary Trend in the North of England

Salary distribution trend for jobs in the North of England citing JIRA.

Salary distribution trend for jobs in the North of England citing JIRA

JIRA
Salary Histogram in the North of England

Salary distribution for jobs citing JIRA in the North of England over the 6 months to 30 October 2025.

Salary histogram for JIRA in the North of England

JIRA
Job Locations in the North of England

The table below looks at the demand and provides a guide to the median salaries quoted in IT jobs citing JIRA within the North of England region over the 6 months to 30 October 2025. The 'Rank Change' column provides an indication of the change in demand within each location based on the same 6 month period last year.

Location Rank Change
on Same Period
Last Year
Matching
Permanent
IT Job Ads
Median Salary
Past 6 Months
Median Salary
% Change
on Same Period
Last Year
Live
Jobs
North West +24 182 £47,683 -17.07% 68
Yorkshire +29 67 £46,250 +7.13% 32
North East -19 18 £51,500 -17.60% 19
JIRA
England

JIRA
Co-Occurring Skills & Capabilities in the North of England by Category

The following tables expand on the one above by listing co-occurrences grouped by category. They cover the same employment type, locality and period, with up to 20 co-occurrences shown in each category:

Application Platforms
1 88 (32.96%) Confluence
2 12 (4.49%) CMS
3 8 (3.00%) WordPress
4 7 (2.62%) Umbraco
5 2 (0.75%) Apache
5 2 (0.75%) Headless CMS
5 2 (0.75%) SharePoint
6 1 (0.37%) Adobe Experience Manager
6 1 (0.37%) Apache Airflow
6 1 (0.37%) FileNet
6 1 (0.37%) JBoss
6 1 (0.37%) nginx
6 1 (0.37%) Sitecore CMS
6 1 (0.37%) WebSphere
Applications
1 15 (5.62%) Microsoft Excel
2 12 (4.49%) MS Visio
3 11 (4.12%) Microsoft Project
4 9 (3.37%) Trello
5 3 (1.12%) Chatbot
6 1 (0.37%) CANalyzer
6 1 (0.37%) Microsoft Office
Business Applications
1 2 (0.75%) Markit EDM
1 2 (0.75%) SAP S/4HANA
2 1 (0.37%) Payment Gateway
2 1 (0.37%) Salesforce CRM
2 1 (0.37%) SAP IBP
2 1 (0.37%) SAP MII
Cloud Services
1 152 (56.93%) Azure
2 136 (50.94%) AWS
3 44 (16.48%) GCP
4 11 (4.12%) GitHub
5 10 (3.75%) Azure DevOps
6 8 (3.00%) Entra ID
6 8 (3.00%) SaaS
6 8 (3.00%) Slack
7 7 (2.62%) Microsoft 365
8 6 (2.25%) Power Platform
9 5 (1.87%) Figma
10 4 (1.50%) Adobe Analytics
10 4 (1.50%) PaaS
11 3 (1.12%) Contentful
12 2 (0.75%) Azure Monitor
12 2 (0.75%) Google Analytics
13 1 (0.37%) Amazon EC2
13 1 (0.37%) AWS Lambda
13 1 (0.37%) Cloud Computing
13 1 (0.37%) OpenShift
Communications & Networking
1 3 (1.12%) SAN
2 2 (0.75%) DNS
2 2 (0.75%) HTTP
3 1 (0.37%) Ethernet
3 1 (0.37%) Firewall
3 1 (0.37%) Network Security
3 1 (0.37%) RFID
3 1 (0.37%) SSH
3 1 (0.37%) SSL
3 1 (0.37%) TCP/IP
3 1 (0.37%) VLAN
3 1 (0.37%) VPN
Database & Business Intelligence
1 124 (46.44%) SQL Server
2 9 (3.37%) MongoDB
2 9 (3.37%) PostgreSQL
3 8 (3.00%) NoSQL
3 8 (3.00%) SQL Server Analysis Services
4 7 (2.62%) Data Warehouse
5 6 (2.25%) OLAP
5 6 (2.25%) Power BI
6 5 (1.87%) Relational Database
7 3 (1.12%) MySQL
8 2 (0.75%) SQL Server Integration Services
8 2 (0.75%) SQL Server Reporting Services
9 1 (0.37%) Elasticsearch
9 1 (0.37%) Electronic Patient Records
9 1 (0.37%) Redis
Development Applications
1 122 (45.69%) Bitbucket
2 120 (44.94%) Cucumber
2 120 (44.94%) GitLab
2 120 (44.94%) Selenium
3 116 (43.45%) SonarQube
4 115 (43.07%) Maven
5 114 (42.70%) Sonatype Nexus
6 16 (5.99%) Git
7 4 (1.50%) Artifactory
7 4 (1.50%) JUnit
8 3 (1.12%) Jenkins
8 3 (1.12%) JIRA Agile
8 3 (1.12%) Octopus Deploy
8 3 (1.12%) TeamCity
9 2 (0.75%) Rational DOORS
10 1 (0.37%) Appium
10 1 (0.37%) CANoe
10 1 (0.37%) Cypress.io
10 1 (0.37%) Mockito
10 1 (0.37%) SpecFlow
General
1 147 (55.06%) Finance
2 122 (45.69%) Banking
3 112 (41.95%) Inclusion and Diversity
4 77 (28.84%) Retail
5 72 (26.97%) Corporate Banking
5 72 (26.97%) Investment Banking
6 69 (25.84%) Social Skills
7 17 (6.37%) Analytical Skills
8 13 (4.87%) Law
9 10 (3.75%) Influencing Skills
10 9 (3.37%) Marketing
11 6 (2.25%) Advertising
11 6 (2.25%) Organisational Skills
12 5 (1.87%) Automotive
13 4 (1.50%) Manufacturing
14 3 (1.12%) Avionics
15 2 (0.75%) Games
15 2 (0.75%) Health Technology
15 2 (0.75%) Legal
15 2 (0.75%) Public Sector
Job Titles
1 117 (43.82%) Software Engineer
2 32 (11.99%) Developer
3 28 (10.49%) Analyst
4 16 (5.99%) JIRA Developer
5 14 (5.24%) Business Analyst
5 14 (5.24%) Senior
6 11 (4.12%) Project Manager
7 8 (3.00%) Consultant
8 7 (2.62%) Account Manager
8 7 (2.62%) Lead
9 6 (2.25%) Applications Support
9 6 (2.25%) Applications Support Analyst
9 6 (2.25%) DevOps Engineer
9 6 (2.25%) Java Engineer
9 6 (2.25%) SQL Developer
9 6 (2.25%) Support Analyst
9 6 (2.25%) Systems Engineer
10 5 (1.87%) Senior Manager
10 5 (1.87%) Software Consultant
10 5 (1.87%) Support Consultant
Libraries, Frameworks & Software Standards
1 121 (45.32%) Kafka
1 121 (45.32%) Spring Boot
2 120 (44.94%) React
2 120 (44.94%) Spring
3 118 (44.19%) HTML
4 117 (43.82%) CSS
5 116 (43.45%) Redux
6 113 (42.32%) JPA
7 74 (27.72%) REST
7 74 (27.72%) RESTful
8 73 (27.34%) Jest
9 72 (26.97%) CSS3
9 72 (26.97%) HTML5
9 72 (26.97%) Sass
10 41 (15.36%) Hibernate
11 4 (1.50%) Elastic Stack
11 4 (1.50%) Node.js
12 3 (1.12%) .NET
12 3 (1.12%) Bootstrap
13 2 (0.75%) Middleware
Miscellaneous
1 124 (46.44%) Product Ownership
2 112 (41.95%) Enterprise Software
3 6 (2.25%) Social Media
3 6 (2.25%) Wiki
4 5 (1.87%) Onboarding
5 3 (1.12%) Analytical Mindset
5 3 (1.12%) Greenfield Project
5 3 (1.12%) Mobile App
6 2 (0.75%) Client/Server
6 2 (0.75%) Derivative
6 2 (0.75%) Distributed Systems
6 2 (0.75%) Driving Licence
6 2 (0.75%) Equities
6 2 (0.75%) Fixed Income
6 2 (0.75%) Foreign Exchange (FX)
6 2 (0.75%) Security Posture
7 1 (0.37%) Autonomous Agent
7 1 (0.37%) Operational Technology
7 1 (0.37%) Self-Motivation
7 1 (0.37%) Sports Betting
Operating Systems
1 18 (6.74%) Windows
2 13 (4.87%) Linux
3 1 (0.37%) Check Point GAiA
3 1 (0.37%) Fedora
3 1 (0.37%) Red Hat Enterprise Linux
Processes & Methodologies
1 183 (68.54%) Agile
2 147 (55.06%) DevOps
3 136 (50.94%) CI/CD
4 134 (50.19%) Containerisation
5 127 (47.57%) Software Engineering
6 122 (45.69%) Microservices
6 122 (45.69%) Test Automation
7 121 (45.32%) SDLC
8 119 (44.57%) Full-Stack Development
9 114 (42.70%) Front End Development
10 113 (42.32%) Performance Optimisation
11 90 (33.71%) Mentoring
12 86 (32.21%) User Experience
13 80 (29.96%) Migration
14 75 (28.09%) Strategic Thinking
15 74 (27.72%) Responsive Web Design
16 72 (26.97%) Continuous Improvement
17 48 (17.98%) TDD
18 45 (16.85%) Problem-Solving
19 40 (14.98%) Clean Code
Programming Languages
1 140 (52.43%) JavaScript
2 137 (51.31%) SQL
3 127 (47.57%) Java
4 81 (30.34%) TypeScript
5 22 (8.24%) PowerShell
6 14 (5.24%) Python
7 6 (2.25%) C#
7 6 (2.25%) T-SQL
8 5 (1.87%) Bash
9 3 (1.12%) Apex Code
9 3 (1.12%) PHP
10 2 (0.75%) SOQL
11 1 (0.37%) C
11 1 (0.37%) C++
11 1 (0.37%) Groovy
Qualifications
1 55 (20.60%) Degree
2 16 (5.99%) ITIL Foundation Certificate
3 12 (4.49%) Computer Science Degree
4 10 (3.75%) BPSS Clearance
5 8 (3.00%) DBS Check
6 7 (2.62%) PMP
7 6 (2.25%) ITIL Certification
7 6 (2.25%) PMI Certification
8 2 (0.75%) Chartered Engineer
8 2 (0.75%) Master's Degree
8 2 (0.75%) SAP Certification
8 2 (0.75%) SC Cleared
8 2 (0.75%) Security Cleared
9 1 (0.37%) CCSA
9 1 (0.37%) CCSE
9 1 (0.37%) CISM
9 1 (0.37%) CISSP
9 1 (0.37%) PhD
Quality Assurance & Compliance
1 132 (49.44%) QA
2 77 (28.84%) Accessibility
3 4 (1.50%) Data Quality
3 4 (1.50%) GDPR
4 2 (0.75%) ISO/IEC 12207
4 2 (0.75%) ISO/IEC 15288
4 2 (0.75%) NIST
4 2 (0.75%) PMO
4 2 (0.75%) SLA
5 1 (0.37%) AUTOSAR
5 1 (0.37%) California Consumer Privacy Act
5 1 (0.37%) ISO/IEC 27001
5 1 (0.37%) WCAG
System Software
1 125 (46.82%) Docker
2 8 (3.00%) Active Directory
3 3 (1.12%) VMware Infrastructure
3 3 (1.12%) vSphere
4 1 (0.37%) VMware ESXi
Systems Management
1 129 (48.31%) Kubernetes
2 9 (3.37%) Control-M
2 9 (3.37%) Grafana
3 6 (2.25%) Ansible
3 6 (2.25%) Prometheus
4 5 (1.87%) Microsoft Intune
5 3 (1.12%) Docker Swarm
5 3 (1.12%) Terraform
6 1 (0.37%) FortiGate
6 1 (0.37%) Podman
6 1 (0.37%) Puppet
6 1 (0.37%) SCOM
6 1 (0.37%) vCenter Server
Vendors
1 112 (41.95%) Solace
2 22 (8.24%) Atlassian
3 21 (7.87%) Microsoft
4 11 (4.12%) Salesforce
5 6 (2.25%) Adobe
5 6 (2.25%) Google
6 5 (1.87%) SAP
6 5 (1.87%) ServiceNow
7 4 (1.50%) IBM
8 3 (1.12%) Bloomberg
8 3 (1.12%) Forcepoint
8 3 (1.12%) Proofpoint
8 3 (1.12%) Qualtrics
8 3 (1.12%) VMware
8 3 (1.12%) Zscaler
9 2 (0.75%) Alteryx
9 2 (0.75%) Databricks
9 2 (0.75%) HubSpot
9 2 (0.75%) Informatica
9 2 (0.75%) Siemens