QA Jobs in the North of England

Quality Assurance (QA)
England > North of England

The table below provides summary statistics for permanent job vacancies advertised in the North of England requiring QA skills. It includes a benchmarking guide to the annual salaries offered in vacancies that cited QA over the 6 months leading up to 26 July 2024, comparing them to the same period in the previous two years.

6 months to
26 Jul 2024
Same period 2023 Same period 2022
Rank 61 43 46
Rank change year-on-year -18 +3 +34
Permanent jobs citing QA 506 872 1,117
As % of all permanent jobs advertised in the North of England 3.10% 6.72% 5.83%
As % of the Quality Assurance & Compliance category 24.76% 43.86% 31.18%
Number of salaries quoted 287 277 406
10th Percentile £26,000 £29,420 £32,625
25th Percentile £32,500 £41,250 £40,000
Median annual salary (50th Percentile) £45,000 £55,000 £50,000
Median % change year-on-year -18.18% +10.00% +5.26%
75th Percentile £62,500 £68,750 £61,250
90th Percentile £70,000 £88,750 £72,500
England median annual salary £52,500 £60,000 £57,500
% change year-on-year -12.50% +4.35% +4.55%

All Quality Assurance and Compliance Skills
North of England

QA falls under the Quality Assurance and Compliance category. For comparison with the information above, the following table provides summary statistics for all permanent job vacancies requiring quality assurance or compliance skills in the North of England.

Permanent vacancies with a requirement for quality assurance or compliance skills 2,044 1,988 3,582
As % of all permanent jobs advertised in the North of England 12.54% 15.32% 18.69%
Number of salaries quoted 1,279 1,096 1,871
10th Percentile £25,450 £28,250 £25,750
25th Percentile £32,500 £37,500 £33,500
Median annual salary (50th Percentile) £48,000 £50,000 £47,500
Median % change year-on-year -4.00% +5.26% +5.56%
75th Percentile £62,500 £65,313 £62,500
90th Percentile £80,648 £82,500 £75,000
England median annual salary £55,000 £58,000 £55,000
% change year-on-year -5.17% +5.45% -

QA
Job Vacancy Trend in the North of England

Job postings citing QA as a proportion of all IT jobs advertised in the North of England.
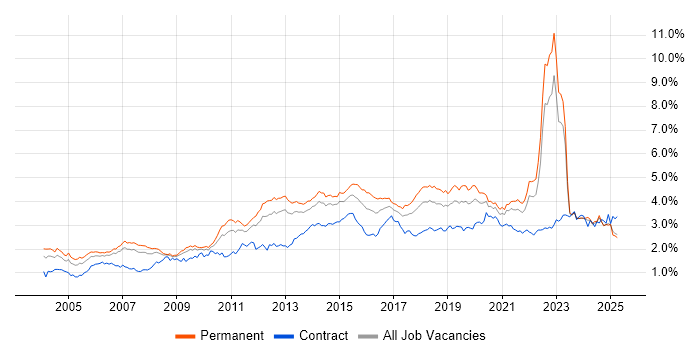
Job vacancy trend for QA in the North of England

QA
Salary Trend in the North of England

3-month moving average salary quoted in jobs citing QA in the North of England.

Salary trend for QA in the North of England

QA
Salary Histogram in the North of England

Salary distribution for jobs citing QA in the North of England over the 6 months to 26 July 2024.

Salary histogram for QA in the North of England

QA
Job Locations in the North of England

The table below looks at the demand and provides a guide to the median salaries quoted in IT jobs citing QA within the North of England region over the 6 months to 26 July 2024. The 'Rank Change' column provides an indication of the change in demand within each location based on the same 6 month period last year.

Location Rank Change
on Same Period
Last Year
Matching
Permanent
IT Job Ads
Median Salary
Past 6 Months
Median Salary
% Change
on Same Period
Last Year
Live
Jobs
North West -28 280 £45,000 -7.69% 86
Yorkshire -15 165 £45,000 -18.18% 41
North East -15 61 £41,774 -30.38% 28
QA
England

QA
Co-occurring Skills and Capabilities in the North of England by Category

The follow tables expand on the table above by listing co-occurrences grouped by category. The same employment type, locality and period is covered with up to 20 co-occurrences shown in each of the following categories:

Application Platforms
1 16 (3.16%) IIS
2 5 (0.99%) Confluence
3 4 (0.79%) CMS
4 3 (0.59%) BizTalk Server
4 3 (0.59%) SharePoint
5 2 (0.40%) Apache Solr
6 1 (0.20%) Drupal
6 1 (0.20%) IBM Domino
6 1 (0.20%) Umbraco
6 1 (0.20%) WordPress
Applications
1 8 (1.58%) Microsoft Office
2 7 (1.38%) Microsoft Excel
2 7 (1.38%) Microsoft Project
3 4 (0.79%) Chatbot
4 3 (0.59%) Spreadsheet
5 2 (0.40%) Adobe Illustrator
5 2 (0.40%) MS Visio
5 2 (0.40%) Photoshop
6 1 (0.20%) Microsoft PowerPoint
6 1 (0.20%) Sketch
6 1 (0.20%) SOLIDWORKS
Business Applications
1 7 (1.38%) Dynamics CRM
2 3 (0.59%) SAP IBP
2 3 (0.59%) Shopify
3 2 (0.40%) SAP MII
4 1 (0.20%) Dynamics NAV
4 1 (0.20%) Magento
4 1 (0.20%) NEC Housing
4 1 (0.20%) Payment Gateway
4 1 (0.20%) SAP S/4HANA
Cloud Services
1 85 (16.80%) Azure
2 40 (7.91%) Azure DevOps
3 36 (7.11%) SaaS
4 24 (4.74%) AWS
5 11 (2.17%) Microsoft 365
6 10 (1.98%) Dynamics 365
6 10 (1.98%) Power Platform
7 7 (1.38%) OCI
8 6 (1.19%) Azure Data Factory
9 4 (0.79%) BrowserStack
9 4 (0.79%) Google Play
9 4 (0.79%) Serverless
10 3 (0.59%) Azure Functions
10 3 (0.59%) GCP
11 2 (0.40%) Azure Logic Apps
11 2 (0.40%) Azure Stack
11 2 (0.40%) BlazeMeter
11 2 (0.40%) Snowflake
12 1 (0.20%) BigCommerce
12 1 (0.20%) Figma
Communications & Networking
1 2 (0.40%) DSL
1 2 (0.40%) HTTP
1 2 (0.40%) Internet
2 1 (0.20%) Modbus
2 1 (0.20%) MQTT
Database & Business Intelligence
1 50 (9.88%) SQL Server
2 9 (1.78%) Relational Database
3 8 (1.58%) Data Warehouse
3 8 (1.58%) PostgreSQL
4 7 (1.38%) Oracle Database
5 5 (0.99%) MySQL
6 4 (0.79%) NoSQL
6 4 (0.79%) SQL Server Integration Services
7 3 (0.59%) MongoDB
8 2 (0.40%) RDBMS
9 1 (0.20%) BigQuery
9 1 (0.20%) DynamoDB
9 1 (0.20%) Looker
9 1 (0.20%) MS Access
9 1 (0.20%) OLTP
9 1 (0.20%) SQL Server Reporting Services
9 1 (0.20%) Tableau
Development Applications
1 38 (7.51%) Selenium
2 17 (3.36%) Postman
3 16 (3.16%) Jasmine
3 16 (3.16%) Karma Test Runner
4 15 (2.96%) Appium
4 15 (2.96%) Cypress.io
4 15 (2.96%) JIRA
5 14 (2.77%) Git
6 13 (2.57%) SpecFlow
7 9 (1.78%) WebDriver
8 7 (1.38%) JMeter
9 6 (1.19%) Visual Studio
10 5 (0.99%) TeamCity
11 4 (0.79%) Protractor
12 3 (0.59%) Cucumber
12 3 (0.59%) GitLab
13 2 (0.40%) IntelliJ
13 2 (0.40%) LoadUI
14 1 (0.20%) NUnit
14 1 (0.20%) TestComplete
General
1 138 (27.27%) Social Skills
2 97 (19.17%) Manufacturing
3 88 (17.39%) Pharmaceutical
4 76 (15.02%) Finance
5 65 (12.85%) Analytical Skills
6 31 (6.13%) Marketing
7 30 (5.93%) Legal
8 27 (5.34%) Retail
9 24 (4.74%) Public Sector
10 22 (4.35%) Inclusion and Diversity
11 21 (4.15%) Automotive
12 19 (3.75%) Influencing Skills
13 14 (2.77%) Law
14 11 (2.17%) Organisational Skills
15 10 (1.98%) Aerospace
16 6 (1.19%) Games
16 6 (1.19%) Tech for Good
17 2 (0.40%) Aviation
17 2 (0.40%) Presentation Skills
17 2 (0.40%) Social Housing
Job Titles
1 83 (16.40%) Senior
2 80 (15.81%) Developer
3 41 (8.10%) QA Specialist
3 41 (8.10%) Senior Data Warehouse Specialist
4 36 (7.11%) Lead
5 35 (6.92%) QA Manager
6 28 (5.53%) C# Developer
7 26 (5.14%) Tester
8 25 (4.94%) Analyst
9 23 (4.55%) QA Officer
10 22 (4.35%) Quality Manager
11 21 (4.15%) Project Manager
11 21 (4.15%) QA Engineer
12 15 (2.96%) .NET Developer
13 13 (2.57%) Analytics Manager
13 13 (2.57%) Data Analytics Manager
13 13 (2.57%) Senior Developer
13 13 (2.57%) Software Tester
14 11 (2.17%) Development Director
14 11 (2.17%) HR Director
Libraries, Frameworks & Software Standards
1 54 (10.67%) .NET
2 36 (7.11%) JSON
3 31 (6.13%) REST
4 29 (5.73%) XML
5 27 (5.34%) AngularJS
6 26 (5.14%) Web Services
7 19 (3.75%) SOAP
8 18 (3.56%) HTML
8 18 (3.56%) RESTful
9 17 (3.36%) ASP.NET
9 17 (3.36%) XML Schema
10 16 (3.16%) RxJS
10 16 (3.16%) Sass
11 15 (2.96%) React
12 10 (1.98%) .NET Framework
12 10 (1.98%) CSS
12 10 (1.98%) Playwright
12 10 (1.98%) Twitter Bootstrap
13 9 (1.78%) Entity Framework
13 9 (1.78%) Gherkin
Miscellaneous
1 35 (6.92%) Product Ownership
2 32 (6.32%) Management Information System
3 13 (2.57%) Mobile App
3 13 (2.57%) Self-Motivation
4 6 (1.19%) Blog
5 5 (0.99%) Client/Server
5 5 (0.99%) Enterprise Software
5 5 (0.99%) Life Science
5 5 (0.99%) N-Tier
5 5 (0.99%) Social Media
6 4 (0.79%) Fat Client
6 4 (0.79%) Greenfield Project
6 4 (0.79%) IoT
6 4 (0.79%) NHS
6 4 (0.79%) Onboarding
6 4 (0.79%) Private Cloud
6 4 (0.79%) Thin Client
7 3 (0.59%) Driving Licence
8 2 (0.40%) FMCG
8 2 (0.40%) Team-Oriented Environment
Operating Systems
1 16 (3.16%) Android
2 11 (2.17%) Apple iOS
3 10 (1.98%) Windows
4 4 (0.79%) Windows Vista
5 2 (0.40%) Linux
6 1 (0.20%) Ubuntu
Processes & Methodologies
1 148 (29.25%) Agile
2 109 (21.54%) Mentoring
3 93 (18.38%) Continuous Improvement
4 84 (16.60%) Coaching
5 83 (16.40%) DevOps
6 71 (14.03%) Problem-Solving
6 71 (14.03%) Test Automation
7 67 (13.24%) QMS
8 65 (12.85%) Line Management
9 57 (11.26%) Project Management
9 57 (11.26%) SDLC
10 51 (10.08%) Software Testing
11 44 (8.70%) Analytics
12 43 (8.50%) CAPA
12 43 (8.50%) Supplier Management
13 37 (7.31%) Code Quality
14 36 (7.11%) Scrum
15 35 (6.92%) CI/CD
15 35 (6.92%) Waterfall
16 34 (6.72%) Project Delivery
Programming Languages
1 81 (16.01%) SQL
2 72 (14.23%) C#
3 62 (12.25%) JavaScript
4 35 (6.92%) Python
5 27 (5.34%) Java
6 22 (4.35%) T-SQL
6 22 (4.35%) TypeScript
7 18 (3.56%) VB
8 16 (3.16%) VB.NET
8 16 (3.16%) VB6
9 15 (2.96%) VBA
10 7 (1.38%) Kotlin
10 7 (1.38%) PL/SQL
11 3 (0.59%) C
11 3 (0.59%) PHP
11 3 (0.59%) PowerShell
11 3 (0.59%) R
11 3 (0.59%) Swift
12 2 (0.40%) C++
Qualifications
1 100 (19.76%) Degree
2 15 (2.96%) Computer Science Degree
3 14 (2.77%) ISTQB
4 8 (1.58%) DBS Check
4 8 (1.58%) HNC
5 7 (1.38%) Security Cleared
6 5 (0.99%) PMI Certification
6 5 (0.99%) PMP
6 5 (0.99%) PRINCE2 Certification
7 4 (0.79%) HND
7 4 (0.79%) Microsoft Certification
7 4 (0.79%) SC Cleared
8 3 (0.59%) MCP
9 2 (0.40%) Chartered Engineer
9 2 (0.40%) ISEB
9 2 (0.40%) ISTQB Foundation Certification
9 2 (0.40%) ITIL Certification
9 2 (0.40%) Master's Degree
10 1 (0.20%) CEH
10 1 (0.20%) SAP Certification
Quality Assurance & Compliance
1 60 (11.86%) GMP
2 12 (2.37%) PMO
3 10 (1.98%) GDPR
4 3 (0.59%) Sarbanes-Oxley
4 3 (0.59%) SLA
4 3 (0.59%) Software Quality Assurance
5 2 (0.40%) ISO 9001
6 1 (0.20%) Data Quality
6 1 (0.20%) GAMP
6 1 (0.20%) ISO/IEC 27001
System Software
1 9 (1.78%) Docker
Systems Management
1 5 (0.99%) Kubernetes
2 1 (0.20%) Functional Safety
2 1 (0.20%) SCCM
Vendors
1 56 (11.07%) Microsoft
2 14 (2.77%) Oracle
3 13 (2.57%) SAP
4 11 (2.17%) BT
4 11 (2.17%) Google
5 9 (1.78%) Cisco
6 3 (0.59%) AVEVA
6 3 (0.59%) Thales
7 2 (0.40%) Adobe
7 2 (0.40%) Remedy
7 2 (0.40%) Salesforce
8 1 (0.20%) Allen-Bradley
8 1 (0.20%) ANSYS
8 1 (0.20%) Apple
8 1 (0.20%) DevExpress
8 1 (0.20%) NEC
8 1 (0.20%) Rockwell
8 1 (0.20%) Siemens
8 1 (0.20%) Sun
8 1 (0.20%) VMware