SC Cleared Job Trends in the North of England

Security Check (SC) Clearance
England > North of England

The table below provides summary statistics for permanent job vacancies advertised in the North of England with a requirement for SC Cleared qualifications. It includes a benchmarking guide to the salaries offered over the 6 months leading up to 21 November 2025, comparing them to the same period in the previous two years.

6 months to
21 Nov 2025
Same period 2024 Same period 2023
Rank 117 86 86
Rank change year-on-year -31 0 +81
Permanent jobs citing SC Cleared 176 302 256
As % of all permanent jobs in the North of England 1.84% 2.46% 3.40%
As % of the Qualifications category 4.87% 8.65% 12.97%
Number of salaries quoted 146 190 197
10th Percentile £31,250 £39,900 £32,863
25th Percentile £46,250 £46,250 £47,500
Median annual salary (50th Percentile) £62,617 £52,500 £60,000
Median % change year-on-year +19.27% -12.50% +4.35%
75th Percentile £78,947 £69,800 £70,000
90th Percentile £90,000 £79,600 £81,750
England median annual salary £60,000 £60,000 £58,000
% change year-on-year - +3.45% +0.87%

All Academic and Professional Certifications
North of England

SC Cleared falls under the Academic Qualifications and Professional Certifications category. For comparison with the information above, the following table provides summary statistics for all permanent job vacancies requiring academic qualifications or professional certifications in the North of England.

Permanent vacancies requiring academic qualifications or professional certifications 3,612 3,491 1,974
As % of all permanent jobs advertised in the North of England 37.72% 28.47% 26.25%
Number of salaries quoted 1,191 1,181 1,250
10th Percentile £26,750 £31,250 £29,000
25th Percentile £28,500 £40,050 £40,156
Median annual salary (50th Percentile) £45,000 £50,055 £54,291
Median % change year-on-year -10.10% -7.80% +8.58%
75th Percentile £60,750 £65,000 £67,500
90th Percentile £77,500 £78,750 £77,500
England median annual salary £55,000 £59,000 £57,500
% change year-on-year -6.78% +2.61% +2.90%

SC Cleared
Job Vacancy Trend in the North of England

Historical trend showing the proportion of permanent IT job postings citing SC Cleared relative to all permanent IT jobs advertised in the North of England.
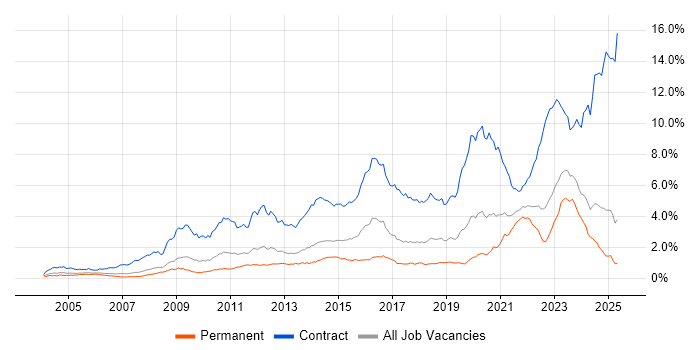
SC Cleared job vacancy trend in the North of England

SC Cleared
Salary Trend in the North of England

Salary distribution trend for jobs in the North of England citing SC Cleared.

Salary distribution trend for jobs in the North of England citing SC Cleared

SC Cleared
Salary Histogram in the North of England

Salary distribution for jobs citing SC Cleared in the North of England over the 6 months to 21 November 2025.

Salary histogram for SC Cleared in the North of England

SC Cleared
Job Locations in the North of England

The table below looks at the demand and provides a guide to the median salaries quoted in IT jobs citing SC Cleared within the North of England region over the 6 months to 21 November 2025. The 'Rank Change' column provides an indication of the change in demand within each location based on the same 6 month period last year.

Location Rank Change
on Same Period
Last Year
Matching
Permanent
IT Job Ads
Median Salary
Past 6 Months
Median Salary
% Change
on Same Period
Last Year
Live
Jobs
North West -28 95 £67,500 +28.57% 99
Yorkshire +22 66 £55,000 +2.33% 25
North East -7 18 £65,000 +4.48% 24
SC Cleared
England

SC Cleared
Co-Occurring Skills & Capabilities in the North of England by Category

The following tables expand on the one above by listing co-occurrences grouped by category. They cover the same employment type, locality and period, with up to 20 co-occurrences shown in each category:

Application Platforms
1 21 (11.93%) Microsoft Exchange
2 2 (1.14%) Apache
2 2 (1.14%) Apache Spark
2 2 (1.14%) SharePoint
3 1 (0.57%) Confluence
Applications
1 14 (7.95%) Microsoft Office
2 10 (5.68%) Microsoft Excel
3 7 (3.98%) Microsoft PowerPoint
4 2 (1.14%) AutoCAD
5 1 (0.57%) Adobe XD
5 1 (0.57%) EPLAN
5 1 (0.57%) InVision
5 1 (0.57%) Sketch
Business Applications
1 2 (1.14%) Dynamics CRM
2 1 (0.57%) Oracle EBS
Cloud Services
1 62 (35.23%) Azure
2 36 (20.45%) AWS
3 21 (11.93%) Microsoft 365
4 17 (9.66%) PaaS
4 17 (9.66%) SaaS
5 16 (9.09%) Dynamics 365
6 13 (7.39%) GCP
7 12 (6.82%) IaaS
8 9 (5.11%) AWS CloudFormation
8 9 (5.11%) Power Platform
9 8 (4.55%) Azure DevOps
10 7 (3.98%) dbt
11 6 (3.41%) Amazon ECS
11 6 (3.41%) GitHub
11 6 (3.41%) Serverless
12 5 (2.84%) Amazon ECR
12 5 (2.84%) Pulumi
13 3 (1.70%) Microsoft Copilot
13 3 (1.70%) OCI
13 3 (1.70%) Sentry
Communications & Networking
1 19 (10.80%) TCP/IP
2 18 (10.23%) DHCP
2 18 (10.23%) DNS
3 9 (5.11%) LAN
3 9 (5.11%) Wi-Fi
4 8 (4.55%) VPN
4 8 (4.55%) WAN
5 6 (3.41%) Firewall
5 6 (3.41%) Network Security
6 4 (2.27%) Junos
7 3 (1.70%) BGP
7 3 (1.70%) IPsec
7 3 (1.70%) OSPF
7 3 (1.70%) VLAN
8 2 (1.14%) AMQP
8 2 (1.14%) Cisco ASA
8 2 (1.14%) DMZ
8 2 (1.14%) EIGRP
8 2 (1.14%) HSRP
8 2 (1.14%) Modbus
Database & Business Intelligence
1 15 (8.52%) PostgreSQL
2 12 (6.82%) MongoDB
2 12 (6.82%) NoSQL
3 6 (3.41%) Elasticsearch
4 5 (2.84%) Amazon RDS
4 5 (2.84%) Redis
5 4 (2.27%) Big Data
5 4 (2.27%) Hadoop
6 3 (1.70%) SQL Server
7 2 (1.14%) Cloudera CDH
7 2 (1.14%) MySQL
7 2 (1.14%) Neo4j
8 1 (0.57%) Azure SQL Database
8 1 (0.57%) Relational Database
Development Applications
1 3 (1.70%) JIRA
1 3 (1.70%) JMeter
2 2 (1.14%) Cucumber
2 2 (1.14%) Jenkins
2 2 (1.14%) Locust
3 1 (0.57%) Axure RP
3 1 (0.57%) Gatling
3 1 (0.57%) Git
3 1 (0.57%) LoadRunner
3 1 (0.57%) Mockito
3 1 (0.57%) NUnit
General
1 53 (30.11%) Social Skills
2 23 (13.07%) Public Sector
3 19 (10.80%) Finance
4 16 (9.09%) Documentation Skills
5 11 (6.25%) Law
6 7 (3.98%) Marketing
7 6 (3.41%) Aerospace
7 6 (3.41%) Inclusion and Diversity
8 5 (2.84%) Presentation Skills
9 4 (2.27%) Analytical Skills
9 4 (2.27%) Manufacturing
9 4 (2.27%) Organisational Skills
10 3 (1.70%) Electronics
10 3 (1.70%) Influencing Skills
10 3 (1.70%) Retail
11 2 (1.14%) Advertising
11 2 (1.14%) Telecoms
12 1 (0.57%) Legal
12 1 (0.57%) Military
12 1 (0.57%) Police
Job Titles
1 28 (15.91%) Developer
2 27 (15.34%) Architect
2 27 (15.34%) Senior
3 22 (12.50%) Consultant
3 22 (12.50%) Lead
4 10 (5.68%) Lead Developer
4 10 (5.68%) Software Developer
5 9 (5.11%) 3rd Line Support
5 9 (5.11%) Dynamics 365 Architect
6 8 (4.55%) Java Developer
7 7 (3.98%) Full-Stack Developer
7 7 (3.98%) Lead Software Developer
8 6 (3.41%) Analyst
8 6 (3.41%) Senior Developer
9 5 (2.84%) Administrator
9 5 (2.84%) Coordinator
9 5 (2.84%) Data Engineer
9 5 (2.84%) Desktop Engineer
9 5 (2.84%) Network Architect
9 5 (2.84%) Technical Consultant
Libraries, Frameworks & Software Standards
1 16 (9.09%) Node.js
2 9 (5.11%) React
3 7 (3.98%) AngularJS
3 7 (3.98%) Django
4 6 (3.41%) .NET
4 6 (3.41%) CSS
4 6 (3.41%) HTML
5 5 (2.84%) REST
5 5 (2.84%) Spring
5 5 (2.84%) Spring Boot
5 5 (2.84%) Vue
6 4 (2.27%) CSS3
6 4 (2.27%) Express.js
6 4 (2.27%) hapi
6 4 (2.27%) HTML5
6 4 (2.27%) NestJS
7 3 (1.70%) PyTorch
7 3 (1.70%) TensorFlow
8 2 (1.14%) scikit-learn
8 2 (1.14%) Swagger
Miscellaneous
1 8 (4.55%) Cloud Native
1 8 (4.55%) Driving Licence
2 5 (2.84%) Management Information System
2 5 (2.84%) Mobile App
3 4 (2.27%) Cyber Threat
3 4 (2.27%) Digital Signage
3 4 (2.27%) Operational Technology
3 4 (2.27%) SCADA
4 3 (1.70%) Cyber Defence
4 3 (1.70%) Home Automation
4 3 (1.70%) Linux Command Line
4 3 (1.70%) Self-Motivation
4 3 (1.70%) Smart Home
5 2 (1.14%) Cyber Kill Chain
5 2 (1.14%) Distributed Systems
5 2 (1.14%) Product Ownership
5 2 (1.14%) Security Posture
6 1 (0.57%) Legacy Systems
6 1 (0.57%) Onboarding
6 1 (0.57%) Team-Oriented Environment
Operating Systems
1 22 (12.50%) Windows
2 15 (8.52%) Windows Server
3 8 (4.55%) Linux
4 6 (3.41%) Unix
5 5 (2.84%) Windows 10
6 3 (1.70%) Red Hat Enterprise Linux
7 2 (1.14%) Android
7 2 (1.14%) Apple iOS
7 2 (1.14%) CentOS
7 2 (1.14%) Debian
7 2 (1.14%) Ubuntu
7 2 (1.14%) Windows 7
Processes & Methodologies
1 38 (21.59%) Agile
2 28 (15.91%) DevOps
3 25 (14.20%) CI/CD
4 23 (13.07%) Problem-Solving
4 23 (13.07%) Project Delivery
5 20 (11.36%) Mentoring
6 19 (10.80%) Stakeholder Management
7 18 (10.23%) Incident Management
7 18 (10.23%) Software Engineering
8 17 (9.66%) Project Management
9 16 (9.09%) Cybersecurity
10 15 (8.52%) Continuous Improvement
10 15 (8.52%) Infrastructure as Code
11 14 (7.95%) Clean Code
12 12 (6.82%) Virtual Environments
13 10 (5.68%) Customer Service
13 10 (5.68%) Security Testing
14 9 (5.11%) Containerisation
14 9 (5.11%) Digital Transformation Programme
14 9 (5.11%) Technical Leadership
Programming Languages
1 24 (13.64%) Python
2 20 (11.36%) Java
3 19 (10.80%) JavaScript
4 18 (10.23%) SQL
5 15 (8.52%) PowerShell
6 7 (3.98%) TypeScript
7 3 (1.70%) C#
8 2 (1.14%) Kotlin
8 2 (1.14%) Scala
9 1 (0.57%) Bash
9 1 (0.57%) Bicep
9 1 (0.57%) C++
9 1 (0.57%) MATLAB
9 1 (0.57%) Shell Script
Qualifications
1 176 (100.00%) Security Cleared
2 21 (11.93%) Degree
3 10 (5.68%) DV Cleared
4 6 (3.41%) CCNP
4 6 (3.41%) Cisco Certification
5 5 (2.84%) PRINCE2 Practitioner
6 4 (2.27%) BPSS Clearance
6 4 (2.27%) CCNA
6 4 (2.27%) JNCIA
7 3 (1.70%) HND
7 3 (1.70%) Master's Degree
8 2 (1.14%) Computer Science Degree
9 1 (0.57%) Azure Certification
9 1 (0.57%) Chartered Engineer
9 1 (0.57%) CISM
9 1 (0.57%) CISSP
9 1 (0.57%) CRISC
9 1 (0.57%) DBS Check
9 1 (0.57%) Microsoft Certification
9 1 (0.57%) PhD
Quality Assurance & Compliance
1 15 (8.52%) QA
2 8 (4.55%) Accessibility
3 7 (3.98%) SLA
4 5 (2.84%) NIST
5 4 (2.27%) PMO
6 3 (1.70%) ISO/IEC 27001
6 3 (1.70%) WCAG
7 2 (1.14%) NCSC
8 1 (0.57%) Cyber Essentials
8 1 (0.57%) Data Quality
8 1 (0.57%) GRC
System Software
1 19 (10.80%) Active Directory
2 12 (6.82%) Hyper-V
2 12 (6.82%) VMware Infrastructure
3 11 (6.25%) Docker
4 1 (0.57%) VMware NSX
Systems Management
1 14 (7.95%) Terraform
2 7 (3.98%) Kubernetes
3 5 (2.84%) Ansible
4 3 (1.70%) AWS Copilot
4 3 (1.70%) SCCM
5 2 (1.14%) Grafana
5 2 (1.14%) Jamf Pro
5 2 (1.14%) Puppet
6 1 (0.57%) VxRail
Vendors
1 51 (28.98%) Microsoft
2 16 (9.09%) VMware
3 11 (6.25%) Google
4 8 (4.55%) Cisco
5 6 (3.41%) Oracle
6 5 (2.84%) ServiceNow
7 4 (2.27%) Juniper
7 4 (2.27%) Palo Alto
7 4 (2.27%) SAP
8 3 (1.70%) Red Hat
9 2 (1.14%) Apple
9 2 (1.14%) Aruba
9 2 (1.14%) CheckPoint
9 2 (1.14%) Citrix
9 2 (1.14%) SaltStack
9 2 (1.14%) Samsung
9 2 (1.14%) Splunk
10 1 (0.57%) AVEVA
10 1 (0.57%) UiPath
10 1 (0.57%) Zscaler