Banking Jobs in the North of England

Banking
England > North of England

The table below looks at the prevalence of the term Banking in permanent job vacancies advertised in the North of England. Included is a benchmarking guide to the salaries offered in vacancies that have cited Banking over the 6 months to 27 April 2024 with a comparison to the same period over the previous 2 years.

6 months to
27 Apr 2024
Same period 2023 Same period 2022
Rank 91 42 143
Rank change year-on-year -49 +101 +73
Permanent jobs citing Banking 450 1,230 459
As % of all permanent jobs advertised in the North of England 2.61% 7.03% 2.55%
As % of the General category 4.67% 9.87% 4.40%
Number of salaries quoted 302 697 241
10th Percentile £38,750 £39,896 £33,750
25th Percentile £56,219 £50,015 £38,250
Median annual salary (50th Percentile) £70,576 £61,180 £55,000
Median % change year-on-year +15.36% +11.24% -15.38%
75th Percentile £87,500 £77,715 £72,500
90th Percentile £100,000 £90,773 £82,500
England median annual salary £83,577 £75,000 £75,000
% change year-on-year +11.44% - -

All General Skills
North of England

Banking is in the General Skills category. The following table is for comparison with the above and provides summary statistics for all permanent job vacancies advertised in the North of England with a requirement for common skills.

Permanent vacancies with a requirement for common skills 9,631 12,458 10,438
As % of all permanent jobs advertised in the North of England 55.84% 71.18% 57.93%
Number of salaries quoted 7,308 5,252 6,107
10th Percentile £26,250 £28,500 £27,811
25th Percentile £33,750 £37,500 £37,500
Median annual salary (50th Percentile) £47,500 £52,500 £50,000
Median % change year-on-year -9.52% +5.00% +11.11%
75th Percentile £63,750 £67,500 £65,000
90th Percentile £77,500 £82,500 £80,000
England median annual salary £52,500 £60,249 £60,000
% change year-on-year -12.86% +0.42% +4.35%

Banking
Job Vacancy Trend in the North of England

Job postings citing Banking as a proportion of all IT jobs advertised in the North of England.
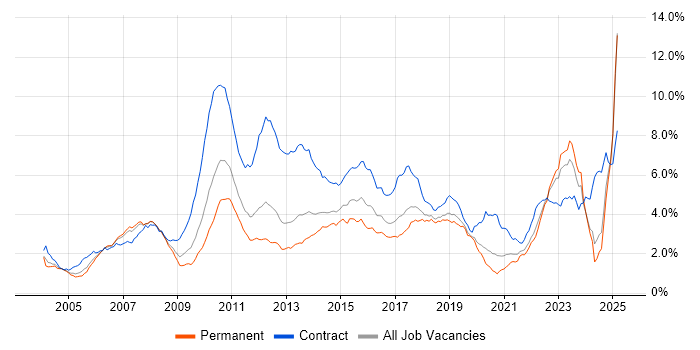
Job vacancy trend for Banking in the North of England

Banking
Salary Trend in the North of England

3-month moving average salary quoted in jobs citing Banking in the North of England.

Salary trend for Banking in the North of England

Banking
Salary Histogram in the North of England

Salary distribution for jobs citing Banking in the North of England over the 6 months to 27 April 2024.

Salary histogram for Banking in the North of England

Banking
Job Locations in the North of England

The table below looks at the demand and provides a guide to the median salaries quoted in IT jobs citing Banking within the North of England region over the 6 months to 27 April 2024. The 'Rank Change' column provides an indication of the change in demand within each location based on the same 6 month period last year.

Location Rank Change
on Same Period
Last Year
Matching
Permanent
IT Job Ads
Median Salary
Past 6 Months
Median Salary
% Change
on Same Period
Last Year
Live
Jobs
Yorkshire -29 215 £70,576 +10.22% 17
North West -62 191 £70,000 +16.67% 44
North East +29 44 £56,750 +106.36% 4
Banking
England

Banking
Co-occurring Skills and Capabilities in the North of England by Category

The follow tables expand on the table above by listing co-occurrences grouped by category. The same employment type, locality and period is covered with up to 20 co-occurrences shown in each of the following categories:

Application Platforms
1 39 (8.67%) SAS
2 30 (6.67%) SharePoint
3 21 (4.67%) Confluence
4 17 (3.78%) Apache Spark
5 12 (2.67%) Captiva
5 12 (2.67%) FileNet
5 12 (2.67%) WebSphere
6 9 (2.00%) Apache
7 2 (0.44%) Tomcat
8 1 (0.22%) Adobe Experience Manager
8 1 (0.22%) Jupyter
Applications
1 41 (9.11%) Microsoft Excel
2 1 (0.22%) EViews
2 1 (0.22%) Spreadsheet
2 1 (0.22%) SPSS
Business Applications
1 7 (1.56%) NetSuite
2 2 (0.44%) Dynamics CRM
3 1 (0.22%) SAP Payroll
Cloud Services
1 112 (24.89%) GCP
2 74 (16.44%) Azure
3 47 (10.44%) Power Platform
4 45 (10.00%) GitHub
5 28 (6.22%) AWS
6 21 (4.67%) PaaS
7 14 (3.11%) Azure DevOps
7 14 (3.11%) SaaS
8 13 (2.89%) Cloud Computing
9 11 (2.44%) IaaS
9 11 (2.44%) OpenShift
10 10 (2.22%) Collibra
10 10 (2.22%) Microsoft 365
11 8 (1.78%) Google Kubernetes Engine
11 8 (1.78%) Slack
12 7 (1.56%) Dynamics 365
12 7 (1.56%) Microsoft Purview
12 7 (1.56%) Power Automate
12 7 (1.56%) PowerApps
13 5 (1.11%) Stripe
Communications & Networking
1 10 (2.22%) Firewall
2 7 (1.56%) Unified Communications
3 6 (1.33%) SMS
4 2 (0.44%) DNS
4 2 (0.44%) SSL
4 2 (0.44%) TCP/IP
5 1 (0.22%) Internet
5 1 (0.22%) Network Security
5 1 (0.22%) SD-WAN
5 1 (0.22%) VSAN
5 1 (0.22%) WAN
Database & Business Intelligence
1 45 (10.00%) Power BI
2 33 (7.33%) Data Warehouse
3 23 (5.11%) NoSQL
4 20 (4.44%) Metadata
5 19 (4.22%) Data Lake
5 19 (4.22%) PostgreSQL
6 15 (3.33%) MySQL
7 13 (2.89%) Data Hub
8 12 (2.67%) BigQuery
9 11 (2.44%) Big Data
10 8 (1.78%) MongoDB
11 7 (1.56%) Apache Cassandra
12 3 (0.67%) DataStage
12 3 (0.67%) IBM InfoSphere
13 2 (0.44%) Azure SQL Data Warehouse
13 2 (0.44%) Crystal Reports
13 2 (0.44%) Hadoop
13 2 (0.44%) QlikView
13 2 (0.44%) SQL Server
13 2 (0.44%) Tableau
Development Applications
1 66 (14.67%) JIRA
2 38 (8.44%) Jenkins
3 29 (6.44%) Git
4 15 (3.33%) Spinnaker
5 14 (3.11%) IBM UrbanCode
6 12 (2.67%) Oracle Forms
7 10 (2.22%) Cucumber
7 10 (2.22%) GitLab
7 10 (2.22%) JUnit
7 10 (2.22%) Selenium
8 9 (2.00%) CircleCI
9 5 (1.11%) Bitbucket
9 5 (1.11%) PHPUnit
10 2 (0.44%) Appium
10 2 (0.44%) REST Assured
10 2 (0.44%) SoapUI
10 2 (0.44%) SOAtest
10 2 (0.44%) TestNG
10 2 (0.44%) WebDriver
10 2 (0.44%) webpack
General
1 373 (82.89%) Finance
2 168 (37.33%) Social Skills
3 104 (23.11%) Legal
4 95 (21.11%) Analytical Skills
5 35 (7.78%) Retail
6 32 (7.11%) Presentation Skills
7 20 (4.44%) Publishing
8 15 (3.33%) Law
9 13 (2.89%) Marketing
10 12 (2.67%) Inclusion and Diversity
11 10 (2.22%) Manufacturing
12 9 (2.00%) Front Office
12 9 (2.00%) Retail Banking
13 8 (1.78%) Public Sector
14 7 (1.56%) Retail Finance
15 6 (1.33%) Influencing Skills
16 5 (1.11%) Games
17 4 (0.89%) Advertising
17 4 (0.89%) Digital Economy
17 4 (0.89%) Investment Banking
Job Titles
1 139 (30.89%) Senior
2 69 (15.33%) Analyst
3 48 (10.67%) Architect
4 46 (10.22%) Senior Analyst
5 44 (9.78%) Software Engineer
6 41 (9.11%) Developer
7 37 (8.22%) Lead
8 23 (5.11%) DevOps Engineer
8 23 (5.11%) Enterprise Architect
9 20 (4.44%) Senior Data Warehouse Specialist
9 20 (4.44%) Senior Developer
10 18 (4.00%) Solutions Architect
11 17 (3.78%) Cloud Engineer
12 13 (2.89%) Support Engineer
13 12 (2.67%) Commercial Architect
13 12 (2.67%) FileNet Engineer
13 12 (2.67%) Senior DevOps
13 12 (2.67%) Senior DevOps Engineer
14 11 (2.44%) Senior Support Engineer
14 11 (2.44%) Splunk Engineer
Libraries, Frameworks & Software Standards
1 22 (4.89%) HTML
2 21 (4.67%) RESTful
3 20 (4.44%) React
4 19 (4.22%) CSS
5 18 (4.00%) Kafka
6 13 (2.89%) .NET
6 13 (2.89%) Node.js
7 12 (2.67%) AngularJS
8 11 (2.44%) OpenID
9 10 (2.22%) JSON
10 7 (1.56%) Express.js
10 7 (1.56%) MEAN Stack
10 7 (1.56%) MERN Stack
10 7 (1.56%) Pandas
10 7 (1.56%) Spring
10 7 (1.56%) Spring Boot
11 5 (1.11%) Sass
11 5 (1.11%) Tailwind CSS
11 5 (1.11%) Vue
11 5 (1.11%) XGBoost
Miscellaneous
1 38 (8.44%) Credit Risk
2 34 (7.56%) Product Ownership
3 29 (6.44%) Public Cloud
4 18 (4.00%) Mainframe
4 18 (4.00%) Private Cloud
5 16 (3.56%) Cloud Native
6 15 (3.33%) Blockchain
7 14 (3.11%) Mobile App
8 12 (2.67%) Data Structures
8 12 (2.67%) DataPower
9 8 (1.78%) Market Risk
10 7 (1.56%) Digital Signage
10 7 (1.56%) Management Information System
10 7 (1.56%) Video Conferencing
11 6 (1.33%) Legacy Applications
11 6 (1.33%) Self-Motivation
12 5 (1.11%) Analytical Mindset
12 5 (1.11%) Onboarding
13 4 (0.89%) Cybercrime
13 4 (0.89%) Data Centre
Operating Systems
1 38 (8.44%) Linux
2 28 (6.22%) Unix
3 17 (3.78%) Windows
4 3 (0.67%) Android
4 3 (0.67%) Apple iOS
4 3 (0.67%) CoreOS
4 3 (0.67%) zOS
5 2 (0.44%) Windows Server
6 1 (0.22%) Debian
6 1 (0.22%) HPUX
6 1 (0.22%) Red Hat Enterprise Linux
6 1 (0.22%) Solaris
6 1 (0.22%) Ubuntu
Processes & Methodologies
1 257 (57.11%) Agile
2 108 (24.00%) Data Management
3 92 (20.44%) DevOps
4 84 (18.67%) Data Governance
5 82 (18.22%) Coaching
6 77 (17.11%) Risk Management
7 75 (16.67%) Analytics
8 72 (16.00%) Problem-Solving
9 69 (15.33%) Roadmaps
10 66 (14.67%) Data Protection
11 63 (14.00%) Process Improvement
12 61 (13.56%) Mentoring
13 60 (13.33%) Data Privacy
13 60 (13.33%) Matrix Management
13 60 (13.33%) Matrix Organization
13 60 (13.33%) Software Engineering
14 47 (10.44%) Continuous Improvement
15 46 (10.22%) CI/CD
15 46 (10.22%) Customer Service
16 43 (9.56%) Business Intelligence
Programming Languages
1 80 (17.78%) SQL
2 72 (16.00%) Java
3 55 (12.22%) Python
4 18 (4.00%) JavaScript
5 14 (3.11%) R
6 11 (2.44%) Groovy
7 9 (2.00%) C#
8 7 (1.56%) Shell Script
9 5 (1.11%) Bash
10 4 (0.89%) PowerShell
11 3 (0.67%) Kotlin
11 3 (0.67%) Swift
12 1 (0.22%) Bicep
12 1 (0.22%) MATLAB
12 1 (0.22%) VB
12 1 (0.22%) VBA
12 1 (0.22%) XAML
Qualifications
1 41 (9.11%) Degree
2 12 (2.67%) ACCA
3 9 (2.00%) OCP
3 9 (2.00%) Oracle Certification
4 8 (1.78%) Computer Science Degree
5 6 (1.33%) CISA
6 4 (0.89%) PMI Certification
6 4 (0.89%) Security Cleared
7 3 (0.67%) Microsoft Certification
8 2 (0.44%) AAT
8 2 (0.44%) CIMA
8 2 (0.44%) DBS Check
8 2 (0.44%) Master's Degree
8 2 (0.44%) SC Cleared
9 1 (0.22%) Azure Certification
9 1 (0.22%) ITIL Certification
9 1 (0.22%) MCSA
9 1 (0.22%) MCSE
9 1 (0.22%) PhD
Quality Assurance & Compliance
1 83 (18.44%) GDPR
2 49 (10.89%) Data Quality
3 29 (6.44%) IFRS
3 29 (6.44%) IFRS 9
4 12 (2.67%) Actionable Recommendations
5 10 (2.22%) CRD IV
6 8 (1.78%) PSD2
7 4 (0.89%) ISO/IEC 27001
8 2 (0.44%) EMIR
8 2 (0.44%) GRC
8 2 (0.44%) MiFID
8 2 (0.44%) PMO
8 2 (0.44%) SLA
9 1 (0.22%) ISO 20022
9 1 (0.22%) QA
9 1 (0.22%) SEPA
System Software
1 23 (5.11%) Docker
2 3 (0.67%) Virtual Machines
3 1 (0.22%) Active Directory
3 1 (0.22%) Hyper-V
Systems Management
1 36 (8.00%) Kubernetes
2 27 (6.00%) Terraform
3 13 (2.89%) Ansible
4 11 (2.44%) Progress Chef
5 5 (1.11%) Istio
6 3 (0.67%) CA Endevor
7 1 (0.22%) Grafana
7 1 (0.22%) Prometheus
7 1 (0.22%) SCCM
7 1 (0.22%) SCOM
Vendors
1 52 (11.56%) Google
2 36 (8.00%) Microsoft
3 31 (6.89%) IBM
4 26 (5.78%) Oracle
5 23 (5.11%) ServiceNow
6 20 (4.44%) SAP
7 12 (2.67%) Kofax
7 12 (2.67%) Pega
7 12 (2.67%) Splunk
8 11 (2.44%) Confluent
9 8 (1.78%) Duck Creek
10 7 (1.56%) Cisco
10 7 (1.56%) MuleSoft
10 7 (1.56%) Salesforce
11 6 (1.33%) CA
12 5 (1.11%) PayPal
12 5 (1.11%) WorldPay
13 4 (0.89%) Teradata
13 4 (0.89%) Workday
14 3 (0.67%) Adobe