GCP Jobs in the North of England

Google Cloud Platform (GCP)
England > North of England

The table below provides summary statistics for permanent job vacancies advertised in the North of England requiring GCP skills. It includes a benchmarking guide to the annual salaries offered in vacancies that cited GCP over the 6 months leading up to 22 June 2025, comparing them to the same period in the previous two years.

6 months to
22 Jun 2025
Same period 2024 Same period 2023
Rank 82 90 25
Rank change year-on-year +8 -65 +43
Permanent jobs citing GCP 439 495 1,379
As % of all permanent jobs advertised in the North of England 3.63% 2.41% 8.99%
As % of the Cloud Services category 18.11% 7.41% 20.32%
Number of salaries quoted 177 284 503
10th Percentile £47,000 £37,500 £46,250
25th Percentile £56,250 £48,250 £50,000
Median annual salary (50th Percentile) £75,000 £65,000 £65,000
Median % change year-on-year +15.38% - +12.44%
75th Percentile £97,528 £77,500 £85,000
90th Percentile £99,084 £87,500 £102,000
England median annual salary £82,500 £80,000 £80,000
% change year-on-year +3.13% - -

All Cloud Skills
North of England

GCP falls under the Cloud Services category. For comparison with the information above, the following table provides summary statistics for all permanent job vacancies requiring cloud computing skills in the North of England.

Permanent vacancies with a requirement for cloud computing skills 2,424 6,682 6,785
As % of all permanent jobs advertised in the North of England 20.03% 32.49% 44.21%
Number of salaries quoted 1,635 5,191 3,815
10th Percentile £27,200 £29,000 £31,250
25th Percentile £36,250 £38,750 £41,250
Median annual salary (50th Percentile) £55,000 £54,000 £55,000
Median % change year-on-year +1.85% -1.82% +4.76%
75th Percentile £72,500 £69,500 £71,250
90th Percentile £87,500 £83,750 £85,000
England median annual salary £60,000 £57,500 £65,000
% change year-on-year +4.35% -11.54% +4.00%

GCP
Job Vacancy Trend in the North of England

Job postings citing GCP as a proportion of all IT jobs advertised in the North of England.
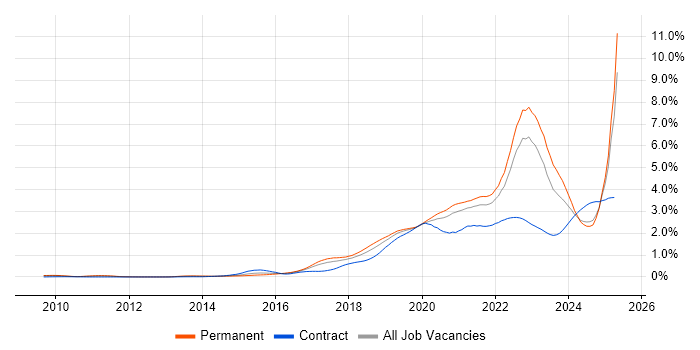
Job vacancy trend for GCP in the North of England

GCP
Salary Trend in the North of England

3-month moving average salary quoted in jobs citing GCP in the North of England.

Salary trend for GCP in the North of England

GCP
Salary Histogram in the North of England

Salary distribution for jobs citing GCP in the North of England over the 6 months to 22 June 2025.

Salary histogram for GCP in the North of England

GCP
Job Locations in the North of England

The table below looks at the demand and provides a guide to the median salaries quoted in IT jobs citing GCP within the North of England region over the 6 months to 22 June 2025. The 'Rank Change' column provides an indication of the change in demand within each location based on the same 6 month period last year.

Location Rank Change
on Same Period
Last Year
Matching
Permanent
IT Job Ads
Median Salary
Past 6 Months
Median Salary
% Change
on Same Period
Last Year
Live
Jobs
North West +28 335 £78,810 +16.76% 605
Yorkshire -19 90 £78,810 +31.35% 352
North East +9 14 £55,750 -25.67% 62
GCP
England

GCP
Co-occurring Skills and Capabilities in the North of England by Category

The follow tables expand on the table above by listing co-occurrences grouped by category. The same employment type, locality and period is covered with up to 20 co-occurrences shown in each of the following categories:

Application Platforms
1 68 (15.49%) Confluence
2 9 (2.05%) Apache Spark
3 7 (1.59%) SAS
4 4 (0.91%) Apache
4 4 (0.91%) Apache Airflow
5 2 (0.46%) CMS
5 2 (0.46%) OpenStack
5 2 (0.46%) Tomcat
5 2 (0.46%) WebSphere
5 2 (0.46%) WebSphere Application Server
5 2 (0.46%) WordPress
6 1 (0.23%) CICS
6 1 (0.23%) IIS
6 1 (0.23%) nginx
Applications
1 2 (0.46%) Chatbot
Business Applications
1 1 (0.23%) Magento
Cloud Services
1 372 (84.74%) Azure
2 362 (82.46%) AWS
3 21 (4.78%) GitHub
4 14 (3.19%) Serverless
5 13 (2.96%) Azure Machine Learning
6 12 (2.73%) Cloud Composer
6 12 (2.73%) dbt
6 12 (2.73%) Power Platform
6 12 (2.73%) SaaS
7 11 (2.51%) Amazon ECS
8 10 (2.28%) AWS Lambda
9 9 (2.05%) Cloud Computing
9 9 (2.05%) Google Kubernetes Engine
10 7 (1.59%) OCI
10 7 (1.59%) Pulumi
11 6 (1.37%) Amazon ElastiCache
11 6 (1.37%) Amazon S3
11 6 (1.37%) Apigee
11 6 (1.37%) AWS CloudFormation
11 6 (1.37%) AWS CodeBuild
Communications & Networking
1 17 (3.87%) TCP/IP
2 11 (2.51%) Firewall
3 10 (2.28%) SAN
3 10 (2.28%) VPN
4 9 (2.05%) Broadband
5 8 (1.82%) DNS
5 8 (1.82%) Network Security
6 7 (1.59%) NAS
7 6 (1.37%) BGP
7 6 (1.37%) OSPF
7 6 (1.37%) VLAN
8 5 (1.14%) DHCP
8 5 (1.14%) VSAN
9 4 (0.91%) 5G
10 3 (0.68%) LAN
10 3 (0.68%) PuTTY
10 3 (0.68%) WAN
11 2 (0.46%) FCoE
11 2 (0.46%) Internet
11 2 (0.46%) iSCSI
Database & Business Intelligence
1 60 (13.67%) SQL Server
2 38 (8.66%) NoSQL
3 37 (8.43%) MySQL
4 35 (7.97%) PostgreSQL
5 26 (5.92%) BigQuery
6 24 (5.47%) MongoDB
7 14 (3.19%) Cloud Spanner
8 12 (2.73%) Power BI
9 8 (1.82%) Amazon RDS
9 8 (1.82%) Elasticsearch
10 7 (1.59%) Amazon Athena
10 7 (1.59%) Amazon Redshift
10 7 (1.59%) Data Warehouse
10 7 (1.59%) Redis
10 7 (1.59%) Relational Database
10 7 (1.59%) Tableau
11 5 (1.14%) Big Data
11 5 (1.14%) Metadata
12 4 (0.91%) Apache Hive
12 4 (0.91%) Looker
Development Applications
1 74 (16.86%) JIRA
2 60 (13.67%) SonarQube
3 50 (11.39%) Sonatype Nexus
4 47 (10.71%) Selenium
5 46 (10.48%) Git
5 46 (10.48%) GitLab
5 46 (10.48%) Maven
6 42 (9.57%) Bitbucket
7 40 (9.11%) Cucumber
8 27 (6.15%) Jenkins
9 11 (2.51%) Oracle Forms
10 5 (1.14%) JUnit
11 4 (0.91%) Appium
11 4 (0.91%) Fiddler
11 4 (0.91%) IBM UrbanCode
11 4 (0.91%) JMeter
11 4 (0.91%) LoadRunner
11 4 (0.91%) Postman
12 3 (0.68%) Artifactory
12 3 (0.68%) Octopus Deploy
General
1 222 (50.57%) Inclusion and Diversity
2 155 (35.31%) Finance
3 132 (30.07%) Banking
4 75 (17.08%) Social Skills
5 34 (7.74%) Analytical Skills
6 12 (2.73%) Public Sector
7 9 (2.05%) Influencing Skills
8 8 (1.82%) Games
9 7 (1.59%) Marketing
10 5 (1.14%) Advertising
10 5 (1.14%) Cantonese Language
10 5 (1.14%) Mandarin Language
10 5 (1.14%) Organisational Skills
10 5 (1.14%) Retail
11 4 (0.91%) Back Office
11 4 (0.91%) Financial Institution
11 4 (0.91%) Telecoms
12 2 (0.46%) Legal
12 2 (0.46%) Presentation Skills
12 2 (0.46%) Tech for Good
Job Titles
1 256 (58.31%) Software Engineer
2 249 (56.72%) Senior
3 194 (44.19%) Senior Software Engineer
4 36 (8.20%) Lead
5 34 (7.74%) Architect
6 29 (6.61%) Developer
7 28 (6.38%) Solutions Architect
8 19 (4.33%) Data Engineer
9 17 (3.87%) DevOps Engineer
9 17 (3.87%) Senior DevOps
10 16 (3.64%) Senior Developer
11 15 (3.42%) AWS Architect
12 13 (2.96%) Cloud Engineer
13 12 (2.73%) AWS Solution Architect
13 12 (2.73%) TOGAF Architect
14 9 (2.05%) Lead Software Engineer
14 9 (2.05%) PHP Developer
15 8 (1.82%) Senior Architect
15 8 (1.82%) Senior PHP Developer
15 8 (1.82%) Senior Solutions Architect
Libraries, Frameworks & Software Standards
1 213 (48.52%) Node.js
2 185 (42.14%) .NET
3 80 (18.22%) React
4 74 (16.86%) Spring Boot
5 71 (16.17%) Spring
6 61 (13.90%) Kafka
7 55 (12.53%) CSS
7 55 (12.53%) HTML
8 48 (10.93%) Hibernate
9 41 (9.34%) Redux
10 40 (9.11%) JPA
11 23 (5.24%) RESTful
12 13 (2.96%) AngularJS
13 11 (2.51%) Django
14 10 (2.28%) OAuth
14 10 (2.28%) Playwright
14 10 (2.28%) Vue
15 9 (2.05%) REST
16 8 (1.82%) Express.js
16 8 (1.82%) LAMP
Miscellaneous
1 176 (40.09%) Self-Motivation
2 172 (39.18%) Cyberattack
2 172 (39.18%) Linux Command Line
3 67 (15.26%) Product Ownership
4 41 (9.34%) Enterprise Software
5 30 (6.83%) Distributed Systems
6 28 (6.38%) Cloud Native
7 19 (4.33%) Algorithms
8 17 (3.87%) Management Information System
9 16 (3.64%) Public Cloud
10 8 (1.82%) Hybrid Cloud
11 5 (1.14%) Clustering
11 5 (1.14%) Credit Risk
11 5 (1.14%) Mainframe
11 5 (1.14%) Private Cloud
12 4 (0.91%) Legacy Systems
12 4 (0.91%) Market Risk
13 2 (0.46%) Data Centre
13 2 (0.46%) Greenfield Project
13 2 (0.46%) Virtual Team
Operating Systems
1 205 (46.70%) Linux
2 16 (3.64%) Unix
3 14 (3.19%) Windows
4 2 (0.46%) Solaris
5 1 (0.23%) Ubuntu
5 1 (0.23%) zOS
Processes & Methodologies
1 325 (74.03%) Agile
2 293 (66.74%) Software Engineering
3 279 (63.55%) Microservices
4 231 (52.62%) Mentoring
5 205 (46.70%) Machine Learning
6 196 (44.65%) Data Engineering
7 182 (41.46%) Scrum
8 180 (41.00%) Site Reliability Engineering
8 180 (41.00%) User Experience
9 179 (40.77%) Cloud Security
10 140 (31.89%) CI/CD
11 136 (30.98%) DevOps
12 94 (21.41%) Test Automation
13 91 (20.73%) Containerisation
14 75 (17.08%) TDD
15 67 (15.26%) Continuous Improvement
16 63 (14.35%) SDLC
17 60 (13.67%) Problem-Solving
18 59 (13.44%) Clean Code
19 53 (12.07%) Performance Optimisation
Programming Languages
1 289 (65.83%) Java
2 271 (61.73%) JavaScript
3 270 (61.50%) Python
4 188 (42.82%) Go
5 174 (39.64%) C++
6 172 (39.18%) Rust
7 113 (25.74%) SQL
8 35 (7.97%) TypeScript
9 27 (6.15%) C#
10 14 (3.19%) PHP
11 11 (2.51%) Bash
12 10 (2.28%) R
13 7 (1.59%) PL/SQL
13 7 (1.59%) Scala
14 6 (1.37%) PowerShell
15 5 (1.14%) Groovy
16 3 (0.68%) Data Analysis Expressions
16 3 (0.68%) PROC SQL
17 1 (0.23%) Perl
17 1 (0.23%) T-SQL
Qualifications
1 186 (42.37%) AWS Certification
2 184 (41.91%) Security Cleared
3 181 (41.23%) AWS Certified Solutions Architect
4 173 (39.41%) DV Cleared
5 172 (39.18%) AWS Certified Developer
6 20 (4.56%) Azure Certification
6 20 (4.56%) Degree
7 12 (2.73%) SC Cleared
8 8 (1.82%) Microsoft Certification
9 7 (1.59%) Master's Degree
10 6 (1.37%) Computer Science Degree
11 5 (1.14%) PhD
11 5 (1.14%) VMware Certified Professional (VCP)
12 4 (0.91%) ISTQB
12 4 (0.91%) TOGAF Certification
13 3 (0.68%) OCP
13 3 (0.68%) Oracle Certification
14 1 (0.23%) CEH
14 1 (0.23%) MBA
14 1 (0.23%) Postgraduate
Quality Assurance & Compliance
1 51 (11.62%) QA
2 15 (3.42%) GDPR
3 14 (3.19%) Data Quality
4 8 (1.82%) HIPAA
4 8 (1.82%) NIST
5 5 (1.14%) Accessibility
6 4 (0.91%) Basel II
6 4 (0.91%) Basel III
6 4 (0.91%) Dodd-Frank
6 4 (0.91%) IFRS
6 4 (0.91%) IFRS 9
6 4 (0.91%) PCI DSS
7 1 (0.23%) Cyber Essentials
7 1 (0.23%) GRC
7 1 (0.23%) ISO/IEC 27001
System Software
1 136 (30.98%) Docker
2 5 (1.14%) VMware Infrastructure
2 5 (1.14%) VMware NSX
3 3 (0.68%) Active Directory
3 3 (0.68%) Apache Flume
3 3 (0.68%) HDFS
3 3 (0.68%) Hyper-V
4 2 (0.46%) KVM
4 2 (0.46%) NFS
4 2 (0.46%) SRDF
4 2 (0.46%) Veritas Cluster Server
4 2 (0.46%) vSphere
4 2 (0.46%) Xen
5 1 (0.23%) VMware ESXi
Systems Management
1 139 (31.66%) Kubernetes
2 48 (10.93%) Terraform
3 22 (5.01%) Ansible
4 14 (3.19%) Grafana
5 10 (2.28%) Istio
6 9 (2.05%) Prometheus
7 8 (1.82%) Progress Chef
8 6 (1.37%) AWS Copilot
9 3 (0.68%) Argo
9 3 (0.68%) Docker Swarm
9 3 (0.68%) Kibana
9 3 (0.68%) logstash
9 3 (0.68%) Oozie
10 2 (0.46%) Control-M
10 2 (0.46%) Microsoft Intune
10 2 (0.46%) Puppet
11 1 (0.23%) CA Service Virtualization
11 1 (0.23%) SCOM
11 1 (0.23%) Single Sign-On
11 1 (0.23%) vCenter Server
Vendors
1 88 (20.05%) Google
2 40 (9.11%) Solace
3 24 (5.47%) Oracle
4 16 (3.64%) Microsoft
5 15 (3.42%) Databricks
6 12 (2.73%) VMware
7 8 (1.82%) IBM
8 6 (1.37%) Atlassian
9 5 (1.14%) SAP
10 4 (0.91%) Cisco
10 4 (0.91%) Informatica
10 4 (0.91%) Palantir
11 3 (0.68%) Dynatrace
11 3 (0.68%) MicroStrategy
11 3 (0.68%) Splunk
11 3 (0.68%) Twitter
12 2 (0.46%) Dell
12 2 (0.46%) EMC
12 2 (0.46%) NetApp
12 2 (0.46%) New Relic