Ansible Jobs in the North of England

Ansible
England > North of England

The table below provides summary statistics for permanent job vacancies advertised in the North of England requiring Ansible skills. It includes a benchmarking guide to the annual salaries offered in vacancies that cited Ansible over the 6 months leading up to 26 July 2024, comparing them to the same period in the previous two years.

6 months to
26 Jul 2024
Same period 2023 Same period 2022
Rank 232 115 154
Rank change year-on-year -117 +39 -66
Permanent jobs citing Ansible 138 389 425
As % of all permanent jobs advertised in the North of England 0.85% 3.00% 2.22%
As % of the Systems Management category 11.27% 22.10% 13.95%
Number of salaries quoted 71 186 244
10th Percentile £42,238 £46,350 £39,750
25th Percentile £47,500 £56,250 £44,688
Median annual salary (50th Percentile) £60,000 £70,000 £60,000
Median % change year-on-year -14.29% +16.67% -
75th Percentile £67,968 £82,500 £74,589
90th Percentile £78,750 £106,289 £87,500
England median annual salary £70,000 £72,500 £72,500
% change year-on-year -3.45% - +3.57%

All Systems Management Skills
North of England

Ansible falls under the Systems Management category. For comparison with the information above, the following table provides summary statistics for all permanent job vacancies requiring systems management skills in the North of England.

Permanent vacancies with a requirement for systems management skills 1,225 1,760 3,047
As % of all permanent jobs advertised in the North of England 7.51% 13.56% 15.90%
Number of salaries quoted 880 1,214 1,899
10th Percentile £29,975 £32,200 £32,500
25th Percentile £41,344 £45,000 £42,500
Median annual salary (50th Percentile) £55,000 £60,000 £59,526
Median % change year-on-year -8.33% +0.80% +8.23%
75th Percentile £70,000 £77,500 £80,000
90th Percentile £83,750 £86,250 £85,000
England median annual salary £62,783 £67,500 £70,000
% change year-on-year -6.99% -3.57% +7.69%

Ansible
Job Vacancy Trend in the North of England

Job postings citing Ansible as a proportion of all IT jobs advertised in the North of England.
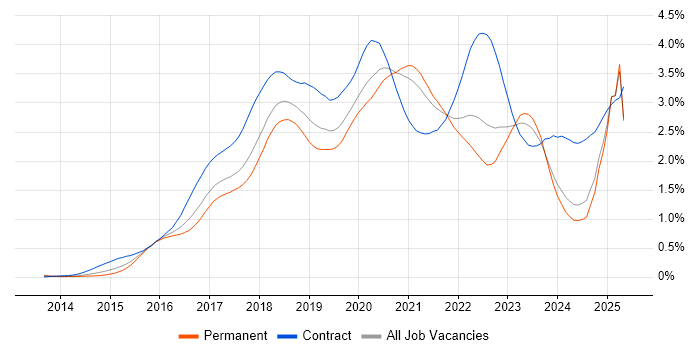
Job vacancy trend for Ansible in the North of England

Ansible
Salary Trend in the North of England

3-month moving average salary quoted in jobs citing Ansible in the North of England.

Salary trend for Ansible in the North of England

Ansible
Salary Histogram in the North of England

Salary distribution for jobs citing Ansible in the North of England over the 6 months to 26 July 2024.

Salary histogram for Ansible in the North of England

Ansible
Job Locations in the North of England

The table below looks at the demand and provides a guide to the median salaries quoted in IT jobs citing Ansible within the North of England region over the 6 months to 26 July 2024. The 'Rank Change' column provides an indication of the change in demand within each location based on the same 6 month period last year.

Location Rank Change
on Same Period
Last Year
Matching
Permanent
IT Job Ads
Median Salary
Past 6 Months
Median Salary
% Change
on Same Period
Last Year
Live
Jobs
North West -95 95 £60,000 -14.29% 7
Yorkshire -41 29 £60,000 -7.69% 9
North East -9 14 £50,500 -6.05% 4
Ansible
England

Ansible
Co-occurring Skills and Capabilities in the North of England by Category

The follow tables expand on the table above by listing co-occurrences grouped by category. The same employment type, locality and period is covered with up to 20 co-occurrences shown in each of the following categories:

Application Platforms
1 32 (23.19%) Apache
2 13 (9.42%) Apache Spark
3 5 (3.62%) SharePoint
4 3 (2.17%) IIS
4 3 (2.17%) Microsoft Exchange
5 2 (1.45%) Apache Airflow
5 2 (1.45%) Confluence
6 1 (0.72%) OpenStack
Cloud Services
1 92 (66.67%) Azure
2 71 (51.45%) AWS
3 25 (18.12%) GCP
4 19 (13.77%) Amazon S3
5 18 (13.04%) AWS CloudFormation
6 16 (11.59%) AWS Lambda
6 16 (11.59%) Serverless
7 14 (10.14%) Amazon EKS
7 14 (10.14%) OpenShift
8 12 (8.70%) Nutanix
9 11 (7.97%) GitHub
10 9 (6.52%) IaaS
11 7 (5.07%) PaaS
12 6 (4.35%) Azure DevOps
13 5 (3.62%) Entra ID
13 5 (3.62%) Microsoft 365
14 4 (2.90%) Amazon CloudWatch
14 4 (2.90%) Amazon EC2
14 4 (2.90%) Amazon ECS
14 4 (2.90%) Cloud Computing
Communications & Networking
1 23 (16.67%) DNS
2 21 (15.22%) Firewall
3 17 (12.32%) VPN
4 16 (11.59%) Internet
5 15 (10.87%) IPsec
5 15 (10.87%) SNMP
6 13 (9.42%) DHCP
7 11 (7.97%) AMQP
8 6 (4.35%) WAN
9 5 (3.62%) LAN
10 4 (2.90%) TCP/IP
10 4 (2.90%) VoIP
11 3 (2.17%) Broadband
11 3 (2.17%) iSCSI
11 3 (2.17%) SAN
11 3 (2.17%) Skype
12 2 (1.45%) Network Security
13 1 (0.72%) Asterisk PBX
13 1 (0.72%) Cisco ASA
13 1 (0.72%) NetScaler
Database & Business Intelligence
1 19 (13.77%) MongoDB
2 17 (12.32%) Elasticsearch
3 14 (10.14%) Amazon RDS
4 13 (9.42%) Big Data
5 11 (7.97%) Cloudera CDH
5 11 (7.97%) Hadoop
6 5 (3.62%) BigQuery
6 5 (3.62%) PostgreSQL
7 4 (2.90%) SQL Server
8 3 (2.17%) Relational Database
9 2 (1.45%) MySQL
9 2 (1.45%) NoSQL
9 2 (1.45%) Power BI
9 2 (1.45%) Redis
10 1 (0.72%) Azure SQL Database
10 1 (0.72%) Flink
10 1 (0.72%) Hazelcast
10 1 (0.72%) RDBMS
Development Applications
1 25 (18.12%) GitLab
2 23 (16.67%) JIRA
3 18 (13.04%) Jenkins
4 17 (12.32%) Git
5 12 (8.70%) Artifactory
6 3 (2.17%) SonarQube
6 3 (2.17%) Terragrunt
7 2 (1.45%) Bitbucket
7 2 (1.45%) Cypress.io
7 2 (1.45%) Jasmine
7 2 (1.45%) NUnit
8 1 (0.72%) Clang
8 1 (0.72%) JMeter
8 1 (0.72%) Maven
8 1 (0.72%) Rational DOORS
8 1 (0.72%) Sonatype Nexus
General
1 29 (21.01%) Public Sector
2 28 (20.29%) Aerospace
3 24 (17.39%) Finance
4 15 (10.87%) Social Skills
5 4 (2.90%) Retail
6 3 (2.17%) Law
7 2 (1.45%) Games
8 1 (0.72%) Analytical Skills
8 1 (0.72%) Automotive
8 1 (0.72%) Banking
8 1 (0.72%) Documentation Skills
8 1 (0.72%) Inclusion and Diversity
8 1 (0.72%) Influencing Skills
8 1 (0.72%) Marketing
8 1 (0.72%) Pharmaceutical
Job Titles
1 35 (25.36%) DevOps Engineer
2 33 (23.91%) Senior
3 32 (23.19%) Infrastructure Engineer
4 17 (12.32%) Cloud Engineer
5 15 (10.87%) Consultant
5 15 (10.87%) NetApp Consultant
5 15 (10.87%) Senior Infrastructure Engineer
5 15 (10.87%) Software Engineer
6 13 (9.42%) Cloud Infrastructure Engineer
7 12 (8.70%) DV Cleared Software Engineer
7 12 (8.70%) Senior Cloud Engineer
8 11 (7.97%) Platform Engineer
9 8 (5.80%) Virtualisation Engineer
9 8 (5.80%) Windows Engineer
9 8 (5.80%) Wintel Engineer
9 8 (5.80%) Wintel Infrastructure Engineer
10 6 (4.35%) AWS DevOps
10 6 (4.35%) AWS Engineer
10 6 (4.35%) IT Engineer
10 6 (4.35%) IT Infrastructure Engineer
Libraries, Frameworks & Software Standards
1 28 (20.29%) RabbitMQ
2 22 (15.94%) REST
3 17 (12.32%) Node.js
4 15 (10.87%) YAML
5 14 (10.14%) Swagger
6 13 (9.42%) AngularJS
6 13 (9.42%) React
6 13 (9.42%) Spring
7 12 (8.70%) Spring Boot
8 11 (7.97%) gRPC
8 11 (7.97%) Material-UI
8 11 (7.97%) OpenAPI
9 5 (3.62%) ARM Templates
10 2 (1.45%) CSS
10 2 (1.45%) Elastic Stack
10 2 (1.45%) Kafka
10 2 (1.45%) Keycloak
10 2 (1.45%) Loki
10 2 (1.45%) NestJS
10 2 (1.45%) SAML
Miscellaneous
1 23 (16.67%) Hybrid Cloud
2 18 (13.04%) Public Cloud
3 17 (12.32%) Data Centre
4 16 (11.59%) Cloud Native
5 12 (8.70%) Clustering
6 8 (5.80%) Enterprise Cloud
7 5 (3.62%) Product Ownership
8 4 (2.90%) Distributed Computing
8 4 (2.90%) Distributed Systems
9 3 (2.17%) Replication
10 2 (1.45%) Enterprise Software
10 2 (1.45%) IoT
11 1 (0.72%) Data Protection Act
11 1 (0.72%) Device Driver
11 1 (0.72%) Digital Media
11 1 (0.72%) Legacy Systems
11 1 (0.72%) PKI
11 1 (0.72%) Private Cloud
Operating Systems
1 83 (60.14%) Linux
2 59 (42.75%) Windows
3 25 (18.12%) Windows Server
4 22 (15.94%) Red Hat Enterprise Linux
5 15 (10.87%) Data ONTAP
6 14 (10.14%) CentOS
7 13 (9.42%) Ubuntu
8 12 (8.70%) Debian
9 3 (2.17%) Unix
10 1 (0.72%) Android
10 1 (0.72%) Apple iOS
10 1 (0.72%) Embedded Linux
10 1 (0.72%) VMS
Processes & Methodologies
1 56 (40.58%) Agile
2 55 (39.86%) DevOps
3 48 (34.78%) Infrastructure as Code
4 43 (31.16%) CI/CD
5 41 (29.71%) Actionable Insight
6 37 (26.81%) Infrastructure Engineering
7 34 (24.64%) Scrum
8 33 (23.91%) Mentoring
9 30 (21.74%) Kanban
10 28 (20.29%) Collaborative Working
11 27 (19.57%) Continuous Integration
11 27 (19.57%) Problem-Solving
12 26 (18.84%) Coaching
13 25 (18.12%) Configuration Management
13 25 (18.12%) Containerisation
14 20 (14.49%) ITIL
14 20 (14.49%) Open Source
14 20 (14.49%) Operational Stability
14 20 (14.49%) Service Management
15 19 (13.77%) Software Engineering
Programming Languages
1 76 (55.07%) Python
2 42 (30.43%) PowerShell
3 22 (15.94%) JavaScript
4 20 (14.49%) Java
5 10 (7.25%) Bash
5 10 (7.25%) Go
6 9 (6.52%) SQL
7 4 (2.90%) C
8 3 (2.17%) C++
8 3 (2.17%) PHP
9 2 (1.45%) TypeScript
10 1 (0.72%) Bicep
10 1 (0.72%) C#
10 1 (0.72%) Fortran
10 1 (0.72%) Perl
10 1 (0.72%) Rust
Qualifications
1 34 (24.64%) Security Cleared
2 30 (21.74%) DV Cleared
3 15 (10.87%) SC Cleared
4 10 (7.25%) Degree
5 7 (5.07%) Azure Certification
6 6 (4.35%) AWS Certification
7 5 (3.62%) Computer Science Degree
8 3 (2.17%) AWS Certified DevOps Engineer
8 3 (2.17%) AWS Certified Solutions Architect
8 3 (2.17%) Microsoft Certification
9 2 (1.45%) ITIL Certification
10 1 (0.72%) CCNP
10 1 (0.72%) Cisco Certification
10 1 (0.72%) MCSM
10 1 (0.72%) Microsoft Certified Architect
10 1 (0.72%) Microsoft Certified Master
10 1 (0.72%) PMI Certification
10 1 (0.72%) PMP
Quality Assurance & Compliance
1 3 (2.17%) NIST
2 2 (1.45%) Cyber Essentials
2 2 (1.45%) PCI DSS
System Software
1 55 (39.86%) Docker
2 29 (21.01%) VMware Infrastructure
3 20 (14.49%) Active Directory
4 13 (9.42%) Hyper-V
5 8 (5.80%) VMware ESXi
6 3 (2.17%) Ceph
6 3 (2.17%) vSphere
7 1 (0.72%) Dovecot
7 1 (0.72%) Embedded Firmware
7 1 (0.72%) Firmware
7 1 (0.72%) KVM
7 1 (0.72%) Postfix
7 1 (0.72%) Virtual Desktop
7 1 (0.72%) VMware NSX
Systems Management
1 85 (61.59%) Terraform
2 72 (52.17%) Kubernetes
3 26 (18.84%) Prometheus
4 23 (16.67%) Puppet
5 15 (10.87%) vCenter Server
6 11 (7.97%) Grafana
7 10 (7.25%) Progress Chef
8 8 (5.80%) Failover Clustering
9 6 (4.35%) Microsoft Data Protection Manager
9 6 (4.35%) SCCM
9 6 (4.35%) SCOM
9 6 (4.35%) WSUS
10 4 (2.90%) IBM BigFix
10 4 (2.90%) Microsoft Intune
11 3 (2.17%) Active Directory Federation Services
11 3 (2.17%) N-central
12 2 (1.45%) Packer
12 2 (1.45%) Rundeck
13 1 (0.72%) Oracle ZFS
13 1 (0.72%) Sysdig
Vendors
1 40 (28.99%) VMware
2 37 (26.81%) Red Hat
3 23 (16.67%) Microsoft
4 18 (13.04%) Palo Alto
5 15 (10.87%) NetApp
5 15 (10.87%) SolidFire
6 14 (10.14%) Google
7 11 (7.97%) SaltStack
8 9 (6.52%) Cisco
9 8 (5.80%) Oracle
10 7 (5.07%) ServiceNow
11 4 (2.90%) Fortinet
12 3 (2.17%) Citrix
12 3 (2.17%) Draytek
12 3 (2.17%) Juniper
12 3 (2.17%) Mitel
12 3 (2.17%) PagerDuty
12 3 (2.17%) Sophos
12 3 (2.17%) Veeam
12 3 (2.17%) Zerto