Manufacturing Jobs in Scotland

Manufacturing
UK > Scotland

The table below looks at the prevalence of the term Manufacturing in permanent job vacancies in Scotland. Included is a benchmarking guide to the salaries offered in vacancies that cited Manufacturing over the 6 months leading up to 6 December 2024, comparing them to the same period in the previous two years.

6 months to
6 Dec 2024
Same period 2023 Same period 2022
Rank 45 98 172
Rank change year-on-year +53 +74 -19
Permanent jobs citing Manufacturing 267 86 64
As % of all permanent jobs advertised in Scotland 5.18% 2.97% 1.28%
As % of the General category 7.44% 3.99% 1.79%
Number of salaries quoted 99 72 45
10th Percentile - £36,250 £30,000
25th Percentile £31,250 £37,500 £38,500
Median annual salary (50th Percentile) £50,000 £47,500 £55,000
Median % change year-on-year +5.26% -13.64% +7.84%
75th Percentile £65,000 £62,500 £62,500
90th Percentile £67,500 £83,625 £70,750
UK median annual salary £50,000 £55,000 £55,000
% change year-on-year -9.09% - +4.76%

All General Skills
Scotland

Manufacturing falls under the General Skills category. For comparison with the information above, the following table provides summary statistics for all permanent job vacancies requiring common skills in Scotland.

Permanent vacancies with a requirement for common skills 3,590 2,155 3,573
As % of all permanent jobs advertised in Scotland 69.61% 74.54% 71.19%
Number of salaries quoted 906 1,407 1,916
10th Percentile £31,250 £25,000 £32,600
25th Percentile £40,000 £32,500 £41,250
Median annual salary (50th Percentile) £53,293 £52,500 £57,500
Median % change year-on-year +1.51% -8.70% +15.00%
75th Percentile £67,500 £71,250 £75,000
90th Percentile £87,001 £84,056 £85,500
UK median annual salary £60,000 £60,000 £60,000
% change year-on-year - - +4.35%

Manufacturing
Job Vacancy Trend in Scotland

Job postings citing Manufacturing as a proportion of all IT jobs advertised in Scotland.
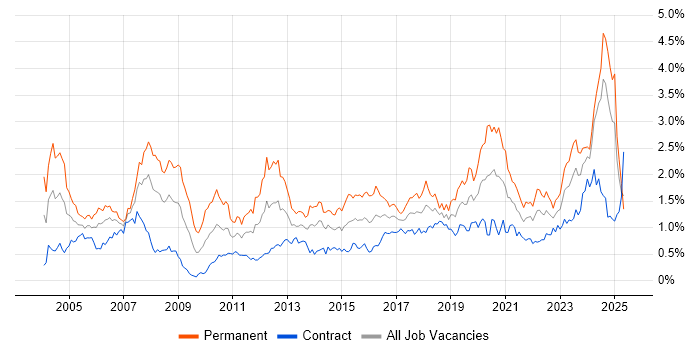
Job vacancy trend for Manufacturing in Scotland

Manufacturing
Salary Trend in Scotland

3-month moving average salary quoted in jobs citing Manufacturing in Scotland.

Salary trend for Manufacturing in Scotland

Manufacturing
Salary Histogram in Scotland

Salary distribution for jobs citing Manufacturing in Scotland over the 6 months to 6 December 2024.

Salary histogram for Manufacturing in Scotland

Manufacturing
Job Locations in Scotland

The table below looks at the demand and provides a guide to the median salaries quoted in IT jobs citing Manufacturing within the Scotland region over the 6 months to 6 December 2024. The 'Rank Change' column provides an indication of the change in demand within each location based on the same 6 month period last year.

Location Rank Change
on Same Period
Last Year
Matching
Permanent
IT Job Ads
Median Salary
Past 6 Months
Median Salary
% Change
on Same Period
Last Year
Live
Jobs
Glasgow +35 42 £43,000 -21.82% 13
Dundee +14 31 £32,500 -35.00% 2
Renfrewshire - 22 £40,000 - 1
Edinburgh +4 18 £56,250 +18.42% 8
Clackmannanshire - 18 £50,000 -
North Lanarkshire - 17 £65,000 - 2
Stirling +6 16 - - 2
South Ayrshire -28 15 £65,000 +18.18% 1
Inverclyde - 14 - - 1
Fife -13 13 £35,250 -25.40% 7
West Lothian -37 13 £55,000 -8.33% 3
Lanarkshire - 11 £50,000 - 7
Aberdeen +9 8 £48,750 -35.00% 4
East Ayrshire - 7 - -
Moray - 5 - -
Aberdeenshire - 4 - - 2
Dumfries and Galloway - 4 - - 2
West Dunbartonshire - 4 - -
South Lanarkshire - 2 £50,000 - 1
Perthshire - 2 - -
Dunbartonshire - 1 - -
Manufacturing
UK

Manufacturing
Co-occurring Skills and Capabilities in Scotland by Category

The follow tables expand on the table above by listing co-occurrences grouped by category. The same employment type, locality and period is covered with up to 20 co-occurrences shown in each of the following categories:

Application Platforms
1 24 (8.99%) SharePoint
2 1 (0.37%) Apache
2 1 (0.37%) Microsoft Exchange
Applications
1 7 (2.62%) Microsoft Excel
2 6 (2.25%) Microsoft Project
3 1 (0.37%) Microsoft Office
Business Applications
1 24 (8.99%) Sage 200
1 24 (8.99%) Sage 50
2 4 (1.50%) SAP PM
2 4 (1.50%) SAP QM
2 4 (1.50%) SAP S/4HANA
3 1 (0.37%) Dynamics CRM
3 1 (0.37%) Infor M3
Cloud Services
1 24 (8.99%) GitHub
2 10 (3.75%) Microsoft 365
3 7 (2.62%) Cloud Computing
4 4 (1.50%) SaaS
5 3 (1.12%) Azure
6 2 (0.75%) Dynamics 365
6 2 (0.75%) Entra ID
6 2 (0.75%) Power Platform
7 1 (0.37%) AWS
7 1 (0.37%) Azure DevOps
Communications & Networking
1 6 (2.25%) VPN
2 5 (1.87%) Firewall
2 5 (1.87%) LAN
2 5 (1.87%) WAN
3 4 (1.50%) Remote Desktop
4 3 (1.12%) Network Security
4 3 (1.12%) RS-232
5 2 (0.75%) Ethernet
5 2 (0.75%) SAN
5 2 (0.75%) Wireless
6 1 (0.37%) DHCP
6 1 (0.37%) DNS
6 1 (0.37%) TCP/IP
Database & Business Intelligence
1 10 (3.75%) Crystal Reports
2 9 (3.37%) SQL Server
3 6 (2.25%) SQL Server Reporting Services
4 2 (0.75%) MS Access
5 1 (0.37%) Data Mining
5 1 (0.37%) MongoDB
5 1 (0.37%) MySQL
5 1 (0.37%) Power BI
Development Applications
1 25 (9.36%) Jenkins
2 24 (8.99%) Visual Studio
3 3 (1.12%) LabVIEW
4 1 (0.37%) Rational DOORS
General
1 43 (16.10%) Pharmaceutical
2 30 (11.24%) Finance
3 25 (9.36%) Social Skills
4 20 (7.49%) Electronics
5 18 (6.74%) Retail
6 13 (4.87%) Analytical Skills
7 7 (2.62%) Advertising
8 5 (1.87%) Banking
8 5 (1.87%) Presentation Skills
9 4 (1.50%) Inclusion and Diversity
9 4 (1.50%) Military
10 3 (1.12%) Law
11 2 (0.75%) Aerospace
11 2 (0.75%) Automotive
11 2 (0.75%) Documentation Skills
12 1 (0.37%) Marketing
12 1 (0.37%) Public Sector
12 1 (0.37%) Telecoms
Job Titles
1 37 (13.86%) Senior
2 29 (10.86%) Developer
3 24 (8.99%) .NET Developer
3 24 (8.99%) .NET Software Developer
4 18 (6.74%) Process Engineer
4 18 (6.74%) Project Engineer
5 14 (5.24%) Project Manager
6 13 (4.87%) Systems Engineer
7 11 (4.12%) Software Engineer
7 11 (4.12%) Technical Advisor
8 10 (3.75%) Analyst
9 7 (2.62%) IT Manager
9 7 (2.62%) Support Analyst
10 6 (2.25%) Consultant
10 6 (2.25%) IT Support
10 6 (2.25%) IT Support Analyst
10 6 (2.25%) Support Consultant
10 6 (2.25%) Technical Consultant
10 6 (2.25%) Technical Support
10 6 (2.25%) Technical Support Consultant
Libraries, Frameworks & Software Standards
1 30 (11.24%) HTML
2 28 (10.49%) CSS
2 28 (10.49%) jQuery
3 25 (9.36%) .NET
3 25 (9.36%) .NET Core
3 25 (9.36%) .NET Framework
4 24 (8.99%) HTML5
4 24 (8.99%) React Native
5 4 (1.50%) JSP
5 4 (1.50%) REST
5 4 (1.50%) Servlets
5 4 (1.50%) SOAP
5 4 (1.50%) Web Services
5 4 (1.50%) WPF
5 4 (1.50%) Yocto
6 2 (0.75%) Entity Framework
7 1 (0.37%) ASP.NET Web API
7 1 (0.37%) Spring
7 1 (0.37%) Spring Boot
7 1 (0.37%) XML
Miscellaneous
1 10 (3.75%) SCADA
2 8 (3.00%) Management Information System
2 8 (3.00%) Operational Technology
3 6 (2.25%) PMI
4 4 (1.50%) Cyber Security Posture
4 4 (1.50%) Renewable Energy
5 2 (0.75%) Device Driver
5 2 (0.75%) Driving Licence
5 2 (0.75%) Embedded Systems
5 2 (0.75%) Product Ownership
6 1 (0.37%) Algorithms
6 1 (0.37%) Arduino
6 1 (0.37%) FMCG
6 1 (0.37%) FPGA
6 1 (0.37%) Life Science
6 1 (0.37%) Linux Command Line
6 1 (0.37%) Onboarding
6 1 (0.37%) Verilog
6 1 (0.37%) VHDL
6 1 (0.37%) Virtual Team
Operating Systems
1 12 (4.49%) Windows
2 7 (2.62%) Linux
3 6 (2.25%) Windows Server
4 5 (1.87%) Embedded Linux
5 4 (1.50%) Windows 10
6 2 (0.75%) ThreadX
Processes & Methodologies
1 39 (14.61%) Service Delivery
2 33 (12.36%) Risk Assessment
3 25 (9.36%) ERP
4 24 (8.99%) Biometrics
4 24 (8.99%) E-Commerce
5 23 (8.61%) Continuous Improvement
5 23 (8.61%) QMS
6 22 (8.24%) CAD
6 22 (8.24%) Manufacturing Engineering
7 20 (7.49%) Experimental Design
7 20 (7.49%) Software Engineering
8 19 (7.12%) Process Improvement
9 18 (6.74%) Project Management
10 14 (5.24%) Chemistry
11 13 (4.87%) Biology
11 13 (4.87%) Biotechnology
11 13 (4.87%) Commercialisation
11 13 (4.87%) Quality Management
12 12 (4.49%) Agile
12 12 (4.49%) Problem-Solving
Programming Languages
1 33 (12.36%) SQL
2 31 (11.61%) JavaScript
3 29 (10.86%) C#
4 25 (9.36%) C
5 8 (3.00%) C++
6 5 (1.87%) Java
7 3 (1.12%) PowerShell
8 2 (0.75%) Embedded C++
8 2 (0.75%) Python
8 2 (0.75%) VBA
9 1 (0.37%) Bicep
Qualifications
1 55 (20.60%) Degree
2 36 (13.48%) NVQ Level 3
3 6 (2.25%) PMI Certification
4 2 (0.75%) CCENT
4 2 (0.75%) CCNA
4 2 (0.75%) Cisco Certification
4 2 (0.75%) DBS Check
4 2 (0.75%) Master's Degree
4 2 (0.75%) MBA
5 1 (0.37%) Computer Science Degree
5 1 (0.37%) HND
Quality Assurance & Compliance
1 19 (7.12%) GMP
1 19 (7.12%) QA
2 6 (2.25%) COSHH
3 2 (0.75%) ISO/IEC 27001
3 2 (0.75%) Sarbanes-Oxley
4 1 (0.37%) Data Quality
4 1 (0.37%) GDPR
4 1 (0.37%) JTAG
System Software
1 10 (3.75%) VMware Infrastructure
2 4 (1.50%) Hyper-V
2 4 (1.50%) Virtual Desktop
3 2 (0.75%) Firmware
4 1 (0.37%) Active Directory
4 1 (0.37%) Embedded Firmware
Systems Management
1 4 (1.50%) SCCM
1 4 (1.50%) Wonderware InTouch
2 1 (0.37%) Terraform
Vendors
1 24 (8.99%) Sage
2 18 (6.74%) Google
3 17 (6.37%) Microsoft
4 10 (3.75%) VMware
5 7 (2.62%) AVEVA
6 6 (2.25%) IFS
6 6 (2.25%) Wonderware
7 5 (1.87%) SAP
8 4 (1.50%) Citrix
8 4 (1.50%) Oracle
8 4 (1.50%) SYSPRO
9 2 (0.75%) Cisco
9 2 (0.75%) QNX
9 2 (0.75%) Rockwell
9 2 (0.75%) Siemens
10 1 (0.37%) Hitachi
10 1 (0.37%) Minitab
10 1 (0.37%) Nintex