Requirements Analysis Jobs in the South East

Requirements Analysis
England > South East

The following table provides summary statistics for permanent job vacancies advertised in the South East with a requirement for Requirements Analysis skills. Included is a benchmarking guide to the salaries offered in vacancies that have cited Requirements Analysis over the 6 months to 17 May 2024 with a comparison to the same period in the previous 2 years.

6 months to
17 May 2024
Same period 2023 Same period 2022
Rank 294 325 350
Rank change year-on-year +31 +25 -27
Permanent jobs citing Requirements Analysis 105 72 137
As % of all permanent jobs advertised in the South East 0.62% 0.50% 0.69%
As % of the Processes & Methodologies category 0.74% 0.53% 0.73%
Number of salaries quoted 42 22 86
10th Percentile £50,375 £38,300 £35,000
25th Percentile £60,000 £41,000 £42,500
Median annual salary (50th Percentile) £70,000 £50,000 £56,000
Median % change year-on-year +40.00% -10.71% +12.00%
75th Percentile £77,188 £76,563 £72,500
90th Percentile £82,500 £91,000 £80,000
England median annual salary £63,500 £60,000 £57,500
% change year-on-year +5.83% +4.35% +27.78%

All Process and Methodology Skills
South East

Requirements Analysis is in the Processes and Methodologies category. The following table is for comparison with the above and provides summary statistics for all permanent job vacancies advertised in the South East with a requirement for process or methodology skills.

Permanent vacancies with a requirement for process or methodology skills 14,228 13,538 18,783
As % of all permanent jobs advertised in the South East 84.33% 94.57% 94.40%
Number of salaries quoted 9,873 7,885 11,857
10th Percentile £27,500 £30,500 £31,250
25th Percentile £36,250 £41,250 £41,450
Median annual salary (50th Percentile) £50,000 £55,000 £55,000
Median % change year-on-year -9.09% - +10.00%
75th Percentile £65,000 £72,500 £70,000
90th Percentile £77,500 £86,250 £83,450
England median annual salary £55,000 £62,500 £60,000
% change year-on-year -12.00% +4.17% +9.09%

Requirements Analysis
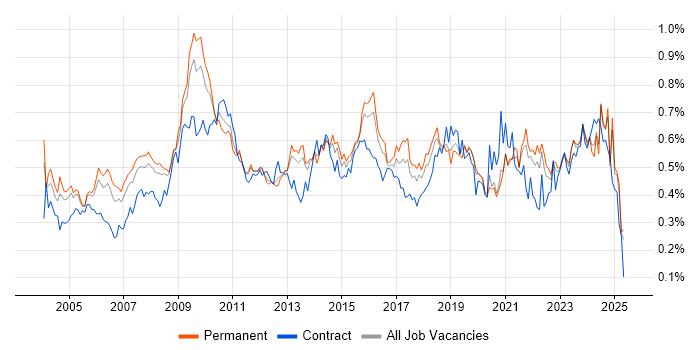
Job Vacancy Trend in the South East

Job postings citing Requirements Analysis as a proportion of all IT jobs advertised in the South East.

Job vacancy trend for Requirements Analysis in the South East

Requirements Analysis
Salary Trend in the South East

3-month moving average salary quoted in jobs citing Requirements Analysis in the South East.

Salary trend for Requirements Analysis in the South East

Requirements Analysis
Salary Histogram in the South East

Salary distribution for jobs citing Requirements Analysis in the South East over the 6 months to 17 May 2024.

Salary histogram for Requirements Analysis in the South East

Requirements Analysis
Job Locations in the South East

The table below looks at the demand and provides a guide to the median salaries quoted in IT jobs citing Requirements Analysis within the South East region over the 6 months to 17 May 2024. The 'Rank Change' column provides an indication of the change in demand within each location based on the same 6 month period last year.

Location Rank Change
on Same Period
Last Year
Matching
Permanent
IT Job Ads
Median Salary
Past 6 Months
Median Salary
% Change
on Same Period
Last Year
Live
Jobs
Hampshire -5 37 £72,500 +45.00% 7
Thames Valley +15 32 £75,000 +93.55% 6
Berkshire +30 24 £70,000 +75.00% 3
Surrey -3 19 £70,000 -17.65% 3
West Sussex +39 11 £64,000 +38.38%
Oxfordshire +11 6 £78,750 - 1
Kent +3 6 £63,500 -
Buckinghamshire -22 2 £50,000 +33.33% 2
Requirements Analysis
England

Requirements Analysis
Co-occurring Skills and Capabilities in the South East by Category

The follow tables expand on the table above by listing co-occurrences grouped by category. The same employment type, locality and period is covered with up to 20 co-occurrences shown in each of the following categories:

Applications
1 2 (1.90%) Simulink
1 2 (1.90%) Stateflow
1 2 (1.90%) TargetLink
Business Applications
1 1 (0.95%) Salesforce CRM
Cloud Services
1 19 (18.10%) Azure
2 13 (12.38%) Cloud Computing
3 8 (7.62%) AWS
4 3 (2.86%) OCI
4 3 (2.86%) SaaS
Communications & Networking
1 13 (12.38%) Firewall
2 1 (0.95%) Network Security
2 1 (0.95%) Wireless
Database & Business Intelligence
1 5 (4.76%) Data Lake
1 5 (4.76%) Data Warehouse
1 5 (4.76%) Relational Database
1 5 (4.76%) SQL Server
1 5 (4.76%) SQL Server Integration Services
Development Applications
1 25 (23.81%) Selenium
2 13 (12.38%) Jenkins
2 13 (12.38%) JIRA
2 13 (12.38%) Robot Framework
3 10 (9.52%) GitLab
4 9 (8.57%) TestRail
5 2 (1.90%) Git
6 1 (0.95%) Cucumber
6 1 (0.95%) Rational DOORS
General
1 39 (37.14%) Aerospace
2 9 (8.57%) Analytical Skills
2 9 (8.57%) Social Skills
3 8 (7.62%) Finance
4 3 (2.86%) Inclusion and Diversity
4 3 (2.86%) Law
5 2 (1.90%) Automotive
5 2 (1.90%) Electronics
5 2 (1.90%) Legal
5 2 (1.90%) Manufacturing
5 2 (1.90%) Retail
6 1 (0.95%) Fire and Rescue
6 1 (0.95%) Military
6 1 (0.95%) Public Sector
Job Titles
1 25 (23.81%) Automation Tester
1 25 (23.81%) Tester
2 15 (14.29%) Analyst
2 15 (14.29%) Lead
3 14 (13.33%) Consultant
4 13 (12.38%) Software Consultant
5 12 (11.43%) Senior
6 8 (7.62%) Architect
6 8 (7.62%) Technical Leader
6 8 (7.62%) Test Analyst
7 7 (6.67%) Business Analyst
7 7 (6.67%) DV Cleared Test Analyst
7 7 (6.67%) IoT Architect
7 7 (6.67%) Systems Architect
8 6 (5.71%) Software Engineer
9 5 (4.76%) Product Manager
10 4 (3.81%) Systems Engineer
11 3 (2.86%) Development Manager
11 3 (2.86%) Oracle Business Analyst
11 3 (2.86%) Software Development Manager
Libraries, Frameworks & Software Standards
1 13 (12.38%) HTML
1 13 (12.38%) XML
2 6 (5.71%) Oracle Fusion
3 3 (2.86%) Unreal Engine
4 1 (0.95%) Gherkin
Miscellaneous
1 13 (12.38%) Linux Command Line
2 10 (9.52%) Product Ownership
3 7 (6.67%) IoT
3 7 (6.67%) Private Cloud
4 5 (4.76%) Augmented Reality
4 5 (4.76%) Virtual Reality
5 2 (1.90%) Acoustics
5 2 (1.90%) Analogue Electronics
5 2 (1.90%) Data Centre
6 1 (0.95%) Cloud Native
6 1 (0.95%) Embedded Systems
6 1 (0.95%) GNSS
6 1 (0.95%) Legacy Applications
6 1 (0.95%) Self-Motivation
Operating Systems
1 26 (24.76%) Linux
2 14 (13.33%) Windows
Processes & Methodologies
1 88 (83.81%) Agile
2 45 (42.86%) Actionable Insight
3 39 (37.14%) Technical Analysis
4 37 (35.24%) Collaborative Working
5 35 (33.33%) Test Automation
6 34 (32.38%) Test Assurance
7 31 (29.52%) DevOps
7 31 (29.52%) Mentoring
8 28 (26.67%) Problem-Solving
9 25 (23.81%) Coaching
9 25 (23.81%) Test Scripting
10 21 (20.00%) CI/CD
11 20 (19.05%) Software Testing
12 18 (17.14%) Systems Engineering
13 17 (16.19%) Change Management
14 16 (15.24%) Scaled Agile Framework
15 15 (14.29%) Computer Science
15 15 (14.29%) Technical Leadership
16 14 (13.33%) Software Engineering
17 13 (12.38%) Service Delivery
Programming Languages
1 34 (32.38%) Python
2 17 (16.19%) JavaScript
3 14 (13.33%) Java
4 13 (12.38%) Bash
5 12 (11.43%) C#
6 10 (9.52%) C
6 10 (9.52%) C++
7 7 (6.67%) TypeScript
8 5 (4.76%) SQL
8 5 (4.76%) T-SQL
9 4 (3.81%) MATLAB
Qualifications
1 53 (50.48%) Security Cleared
2 32 (30.48%) DV Cleared
3 23 (21.90%) Degree
4 13 (12.38%) SC Cleared
5 11 (10.48%) Master's Degree
6 10 (9.52%) Computer Science Degree
7 9 (8.57%) ISTQB
7 9 (8.57%) ISTQB Foundation Certification
8 3 (2.86%) DBS Check
9 2 (1.90%) CBAP
9 2 (1.90%) IIBA
10 1 (0.95%) PhD
Quality Assurance & Compliance
1 49 (46.67%) QA
2 7 (6.67%) ISO 13485
3 3 (2.86%) Accessibility
4 1 (0.95%) ECSS
4 1 (0.95%) ISO 26262
Systems Management
1 13 (12.38%) Kubernetes
2 2 (1.90%) Functional Safety
Vendors
1 13 (12.38%) ServiceNow
2 12 (11.43%) Microsoft
3 6 (5.71%) Oracle
4 4 (3.81%) Salesforce
5 3 (2.86%) Atlassian
5 3 (2.86%) Micro Focus
6 2 (1.90%) Thales