Firmware Jobs in the South East

Firmware
England > South East

The table below provides summary statistics for permanent job vacancies advertised in the South East requiring Firmware skills. It includes a benchmarking guide to the annual salaries offered in vacancies that cited Firmware over the 6 months leading up to 26 July 2024, comparing them to the same period in the previous two years.

6 months to
26 Jul 2024
Same period 2023 Same period 2022
Rank 198 222 314
Rank change year-on-year +24 +92 +28
Permanent jobs citing Firmware 168 144 206
As % of all permanent jobs advertised in the South East 1.11% 1.24% 0.93%
As % of the System Software category 8.79% 7.13% 5.69%
Number of salaries quoted 128 112 109
10th Percentile £32,000 - £34,500
25th Percentile £40,013 £31,250 £47,500
Median annual salary (50th Percentile) £50,000 £42,500 £57,500
Median % change year-on-year +17.65% -26.09% +15.00%
75th Percentile £60,938 £56,188 £65,500
90th Percentile £66,250 £69,750 £72,500
England median annual salary £55,000 £47,500 £55,000
% change year-on-year +15.79% -13.64% -

All System Software Skills
South East

Firmware falls under the System Software category. For comparison with the information above, the following table provides summary statistics for all permanent job vacancies requiring system software skills in the South East.

Permanent vacancies with a requirement for system software skills 1,911 2,020 3,620
As % of all permanent jobs advertised in the South East 12.66% 17.43% 16.41%
Number of salaries quoted 1,458 1,475 2,423
10th Percentile £27,000 £26,250 £27,500
25th Percentile £35,000 £31,734 £36,000
Median annual salary (50th Percentile) £50,000 £49,750 £50,000
Median % change year-on-year +0.50% -0.50% -4.76%
75th Percentile £63,750 £67,500 £72,500
90th Percentile £78,750 £80,000 £85,000
England median annual salary £50,000 £55,000 £55,000
% change year-on-year -9.09% - -4.35%

Firmware
Job Vacancy Trend in the South East

Job postings citing Firmware as a proportion of all IT jobs advertised in the South East.
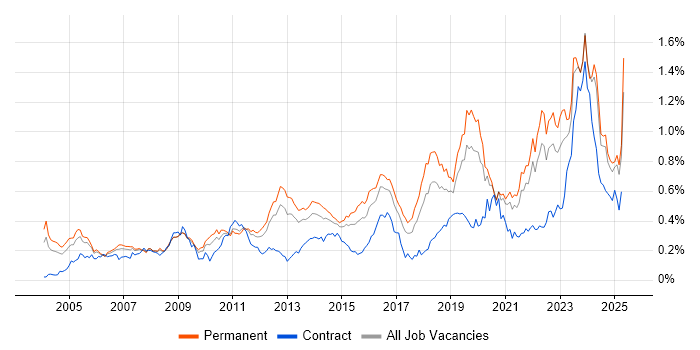
Job vacancy trend for Firmware in the South East

Firmware
Salary Trend in the South East

3-month moving average salary quoted in jobs citing Firmware in the South East.

Salary trend for Firmware in the South East

Firmware
Salary Histogram in the South East

Salary distribution for jobs citing Firmware in the South East over the 6 months to 26 July 2024.

Salary histogram for Firmware in the South East

Firmware
Job Locations in the South East

The table below looks at the demand and provides a guide to the median salaries quoted in IT jobs citing Firmware within the South East region over the 6 months to 26 July 2024. The 'Rank Change' column provides an indication of the change in demand within each location based on the same 6 month period last year.

Location Rank Change
on Same Period
Last Year
Matching
Permanent
IT Job Ads
Median Salary
Past 6 Months
Median Salary
% Change
on Same Period
Last Year
Live
Jobs
Thames Valley +39 79 £48,925 +50.54% 20
Surrey -5 42 £55,000 - 3
Berkshire +31 38 £44,175 -1.83% 4
Hampshire -41 32 £50,000 +25.00% 2
Oxfordshire +4 27 £54,500 +28.24% 5
Buckinghamshire -6 14 £47,500 +46.15% 11
East Sussex - 6 £57,500 - 1
West Sussex +18 3 £46,000 +14.29% 1
Sussex - 3 £60,000 -
Kent - 3 £43,750 - 1
Firmware
England

Firmware
Co-occurring Skills and Capabilities in the South East by Category

The follow tables expand on the table above by listing co-occurrences grouped by category. The same employment type, locality and period is covered with up to 20 co-occurrences shown in each of the following categories:

Application Platforms
1 7 (4.17%) Kinematics
2 6 (3.57%) Microsoft Exchange
3 5 (2.98%) SharePoint
4 1 (0.60%) Apache
4 1 (0.60%) nginx
Applications
1 7 (4.17%) Simulink
2 4 (2.38%) Microsoft Office
2 4 (2.38%) OrCAD
3 1 (0.60%) Microsoft Excel
3 1 (0.60%) SOLIDWORKS
3 1 (0.60%) Spreadsheet
Business Applications
1 1 (0.60%) SAP Business One
Cloud Services
1 9 (5.36%) Azure
2 7 (4.17%) SaaS
3 5 (2.98%) Microsoft 365
3 5 (2.98%) OneDrive
4 4 (2.38%) Cloudflare
4 4 (2.38%) Mimecast
5 3 (1.79%) AWS
5 3 (1.79%) Power Platform
6 2 (1.19%) AWS CloudFormation
6 2 (1.19%) GitHub
6 2 (1.19%) Power Automate
7 1 (0.60%) Akamai
7 1 (0.60%) Azure Data Factory
7 1 (0.60%) Azure Synapse Analytics
7 1 (0.60%) Microsoft Purview
Communications & Networking
1 21 (12.50%) Firewall
2 17 (10.12%) OSPF
2 17 (10.12%) Wireless
3 7 (4.17%) 4G
3 7 (4.17%) Internet
3 7 (4.17%) RFID
3 7 (4.17%) WAN
4 6 (3.57%) Ethernet
5 5 (2.98%) Unified Communications
6 4 (2.38%) BGP
6 4 (2.38%) iSCSI
6 4 (2.38%) Modbus
6 4 (2.38%) NAS
6 4 (2.38%) NetScaler
6 4 (2.38%) RIP
6 4 (2.38%) SAN
7 3 (1.79%) GPRS
7 3 (1.79%) GSM
7 3 (1.79%) MQTT
7 3 (1.79%) TCP/IP
Database & Business Intelligence
1 7 (4.17%) Big Data
2 5 (2.98%) MySQL
3 4 (2.38%) MariaDB
3 4 (2.38%) SQL Server
4 3 (1.79%) Power BI
Development Applications
1 9 (5.36%) Rational DOORS
2 8 (4.76%) Git
3 7 (4.17%) JIRA
4 4 (2.38%) Jenkins
5 3 (1.79%) Subversion
5 3 (1.79%) TestRail
6 2 (1.19%) GitLab
6 2 (1.19%) LabVIEW
7 1 (0.60%) Eclipse
7 1 (0.60%) GDB
7 1 (0.60%) Visual Studio
General
1 60 (35.71%) Electronics
2 37 (22.02%) Social Skills
3 29 (17.26%) Manufacturing
4 24 (14.29%) Marketing
5 21 (12.50%) Finance
6 15 (8.93%) Telecoms
7 12 (7.14%) Automotive
8 11 (6.55%) Public Sector
9 10 (5.95%) Analytical Skills
10 5 (2.98%) Aerospace
11 2 (1.19%) Advertising
12 1 (0.60%) Avionics
12 1 (0.60%) Legal
12 1 (0.60%) Retail
Job Titles
1 42 (25.00%) Embedded Engineer
2 38 (22.62%) Software Engineer
3 29 (17.26%) Electronics Engineer
3 29 (17.26%) Embedded Software Engineer
4 28 (16.67%) Senior
5 24 (14.29%) Systems Engineer
6 17 (10.12%) Firmware Engineer
7 14 (8.33%) Senior Electronics Engineer
8 13 (7.74%) Principal Engineer
9 12 (7.14%) Junior
10 11 (6.55%) Design Engineer
10 11 (6.55%) Graduate
11 9 (5.36%) Build Engineer
11 9 (5.36%) Windows Build Engineer
11 9 (5.36%) Windows Engineer
12 8 (4.76%) Embedded Firmware Engineer
12 8 (4.76%) Graduate Electronics Engineer
12 8 (4.76%) Principal Systems Engineer
13 7 (4.17%) Firewall Specialist
13 7 (4.17%) Network Specialist
Libraries, Frameworks & Software Standards
1 13 (7.74%) 802.1X
2 8 (4.76%) WPF
3 3 (1.79%) Gherkin
3 3 (1.79%) Middleware
4 2 (1.19%) Elastic Stack
4 2 (1.19%) HTML
4 2 (1.19%) Yocto
5 1 (0.60%) ARM Templates
5 1 (0.60%) Azure Blueprints
5 1 (0.60%) Flash
5 1 (0.60%) STL
Miscellaneous
1 32 (19.05%) Embedded Systems
2 25 (14.88%) Data Centre
3 20 (11.90%) Management Information System
4 18 (10.71%) FPGA
5 16 (9.52%) Driving Licence
6 14 (8.33%) Analogue Electronics
7 13 (7.74%) IoT
8 9 (5.36%) Mobile App
9 8 (4.76%) Algorithms
9 8 (4.76%) Device Driver
9 8 (4.76%) VHDL
10 7 (4.17%) GNSS
11 6 (3.57%) Replication
12 5 (2.98%) Self-Motivation
12 5 (2.98%) Verilog
13 4 (2.38%) NB-IoT
13 4 (2.38%) Robotics
14 2 (1.19%) PMI
14 2 (1.19%) Smart Energy
14 2 (1.19%) Social Media
Operating Systems
1 24 (14.29%) Linux
1 24 (14.29%) Windows
2 19 (11.31%) Windows Server
3 10 (5.95%) Windows 10
4 9 (5.36%) Windows NT
4 9 (5.36%) Windows Server 2012
4 9 (5.36%) Windows Server 2016
4 9 (5.36%) Windows Server 2019
5 7 (4.17%) Embedded Linux
6 4 (2.38%) Debian
6 4 (2.38%) Ubuntu
Processes & Methodologies
1 47 (27.98%) Software Engineering
2 35 (20.83%) Problem-Solving
3 34 (20.24%) Customer Requirements
4 26 (15.48%) Agile
5 23 (13.69%) Mentoring
6 22 (13.10%) Collaborative Working
7 21 (12.50%) Validation
8 19 (11.31%) Project Management
9 18 (10.71%) Continuous Improvement
9 18 (10.71%) Release Management
9 18 (10.71%) Schematic Capture
10 16 (9.52%) Artificial Intelligence
10 16 (9.52%) UML
11 15 (8.93%) Cybersecurity
11 15 (8.93%) SDLC
12 14 (8.33%) Computer Science
12 14 (8.33%) Customer Service
12 14 (8.33%) Design for Manufacturing
13 13 (7.74%) Creative Thinking
13 13 (7.74%) Network Management
Programming Languages
1 69 (41.07%) C
2 56 (33.33%) C++
3 27 (16.07%) Python
4 13 (7.74%) C#
5 9 (5.36%) Embedded C
6 7 (4.17%) XAML
7 6 (3.57%) Java
7 6 (3.57%) MATLAB
8 4 (2.38%) Bash
8 4 (2.38%) Embedded C++
8 4 (2.38%) SQL
9 3 (1.79%) Assembly Language
9 3 (1.79%) JavaScript
9 3 (1.79%) Rust
10 2 (1.19%) Perl
11 1 (0.60%) Korn
11 1 (0.60%) PHP
11 1 (0.60%) Ruby
11 1 (0.60%) SystemVerilog
11 1 (0.60%) Tcl
Qualifications
1 68 (40.48%) Degree
2 40 (23.81%) Security Cleared
3 15 (8.93%) SC Cleared
4 13 (7.74%) DV Cleared
5 8 (4.76%) Computer Science Degree
6 6 (3.57%) Master's Degree
7 5 (2.98%) Microsoft Certification
8 3 (1.79%) CCNA
8 3 (1.79%) Cisco Certification
9 2 (1.19%) BPSS Clearance
9 2 (1.19%) MCSE
9 2 (1.19%) PMI Certification
9 2 (1.19%) VMware Certified Professional (VCP)
10 1 (0.60%) CCNP
10 1 (0.60%) HND
10 1 (0.60%) Network+ Certification
Quality Assurance & Compliance
1 22 (13.10%) QA
2 14 (8.33%) SLA
3 3 (1.79%) GDPR
4 2 (1.19%) JTAG
5 1 (0.60%) IEC 61131
5 1 (0.60%) ISO/IEC 15288
System Software
1 50 (29.76%) Embedded Firmware
2 15 (8.93%) Active Directory
3 11 (6.55%) VMware Infrastructure
4 9 (5.36%) vSphere
5 8 (4.76%) Docker
6 4 (2.38%) NFS
6 4 (2.38%) pfSense
6 4 (2.38%) Virtual Desktop
7 3 (1.79%) Virtual Machines
7 3 (1.79%) Virtual Servers
7 3 (1.79%) VMware ESXi
8 1 (0.60%) Hyper-V
Systems Management
1 14 (8.33%) SCCM
2 9 (5.36%) Sysprep
2 9 (5.36%) WSUS
3 6 (3.57%) Kubernetes
4 3 (1.79%) Microsoft Intune
4 3 (1.79%) vCenter Server
5 2 (1.19%) Ansible
5 2 (1.19%) Grafana
5 2 (1.19%) Prometheus
5 2 (1.19%) Terraform
6 1 (0.60%) NetBackup
6 1 (0.60%) SCOM
Vendors
1 25 (14.88%) Microsoft
2 12 (7.14%) SAP
3 11 (6.55%) VMware
4 10 (5.95%) EMC
4 10 (5.95%) Extreme Networks
4 10 (5.95%) Juniper
5 5 (2.98%) Aruba
5 5 (2.98%) Cisco
5 5 (2.98%) Fortinet
5 5 (2.98%) Veeam
6 4 (2.38%) CheckPoint
6 4 (2.38%) Citrix
6 4 (2.38%) NetApp
6 4 (2.38%) QNAP
6 4 (2.38%) Synology
6 4 (2.38%) Ubiquiti
7 3 (1.79%) HP
8 2 (1.19%) BT
8 2 (1.19%) Freescale
8 2 (1.19%) Mitel