Artificial Intelligence Jobs in the South East

Artificial Intelligence (AI)
England > South East

The table below provides summary statistics for permanent job vacancies advertised in the South East requiring Artificial Intelligence skills. It includes a benchmarking guide to the annual salaries offered in vacancies that cited Artificial Intelligence over the 6 months leading up to 29 May 2025, comparing them to the same period in the previous two years.

6 months to
29 May 2025
Same period 2024 Same period 2023
Rank 18 44 149
Rank change year-on-year +26 +105 -60
Permanent jobs citing Artificial Intelligence 783 804 309
As % of all permanent jobs advertised in the South East 8.21% 4.62% 2.19%
As % of the Processes & Methodologies category 8.92% 5.52% 2.32%
Number of salaries quoted 138 451 199
10th Percentile £24,000 £40,000 £43,750
25th Percentile £24,750 £46,250 £61,700
Median annual salary (50th Percentile) £60,000 £67,500 £80,000
Median % change year-on-year -11.11% -15.63% +33.33%
75th Percentile £82,188 £85,000 £95,000
90th Percentile £108,875 £95,000 £115,000
England median annual salary £70,000 £70,000 £75,000
% change year-on-year - -6.67% +7.14%

All Process and Methodology Skills
South East

Artificial Intelligence falls under the Processes and Methodologies category. For comparison with the information above, the following table provides summary statistics for all permanent job vacancies requiring process or methodology skills in the South East.

Permanent vacancies with a requirement for process or methodology skills 8,777 14,553 13,308
As % of all permanent jobs advertised in the South East 92.07% 83.59% 94.48%
Number of salaries quoted 4,223 10,031 7,752
10th Percentile £29,300 £27,750 £30,500
25th Percentile £39,928 £36,750 £41,250
Median annual salary (50th Percentile) £55,000 £50,000 £55,000
Median % change year-on-year +10.00% -9.09% -
75th Percentile £70,000 £65,000 £72,500
90th Percentile £78,750 £77,500 £85,000
England median annual salary £57,500 £55,000 £62,500
% change year-on-year +4.55% -12.00% +4.17%

Artificial Intelligence
Job Vacancy Trend in the South East

Job postings citing Artificial Intelligence as a proportion of all IT jobs advertised in the South East.
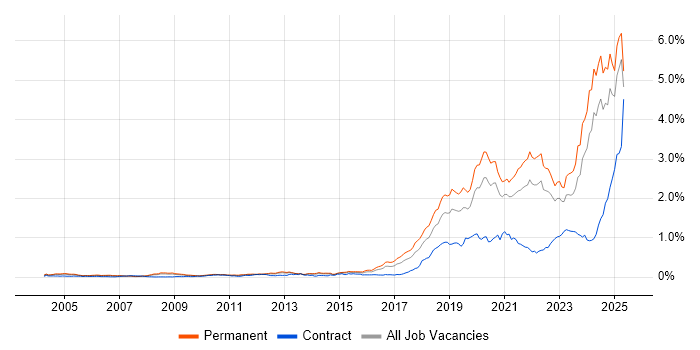
Job vacancy trend for Artificial Intelligence in the South East

Artificial Intelligence
Salary Trend in the South East

3-month moving average salary quoted in jobs citing Artificial Intelligence in the South East.

Salary trend for Artificial Intelligence in the South East

Artificial Intelligence
Salary Histogram in the South East

Salary distribution for jobs citing Artificial Intelligence in the South East over the 6 months to 29 May 2025.

Salary histogram for Artificial Intelligence in the South East

Artificial Intelligence
Job Locations in the South East

The table below looks at the demand and provides a guide to the median salaries quoted in IT jobs citing Artificial Intelligence within the South East region over the 6 months to 29 May 2025. The 'Rank Change' column provides an indication of the change in demand within each location based on the same 6 month period last year.

Location Rank Change
on Same Period
Last Year
Matching
Permanent
IT Job Ads
Median Salary
Past 6 Months
Median Salary
% Change
on Same Period
Last Year
Live
Jobs
Thames Valley +44 393 £60,000 -14.29% 1,881
Buckinghamshire +97 211 £25,500 -60.77% 410
Berkshire +14 155 £90,000 +20.00% 1,215
Hampshire +8 141 £25,500 -57.50% 679
East Sussex +40 114 - - 222
Surrey +11 79 £72,500 +20.83% 448
Middlesex -1 40 - - 8
Oxfordshire +19 27 £70,000 +40.00% 280
Kent +30 12 £27,500 -63.33% 402
West Sussex +32 2 £90,000 +63.64% 209
Artificial Intelligence
England

Artificial Intelligence
Co-occurring Skills and Capabilities in the South East by Category

The follow tables expand on the table above by listing co-occurrences grouped by category. The same employment type, locality and period is covered with up to 20 co-occurrences shown in each of the following categories:

Application Platforms
1 13 (1.66%) Apache Spark
2 8 (1.02%) CMS
3 7 (0.89%) SharePoint
3 7 (0.89%) WordPress
4 4 (0.51%) Apache
5 3 (0.38%) Kentico
6 1 (0.13%) Confluence
6 1 (0.13%) SAS
6 1 (0.13%) Sitefinity
6 1 (0.13%) Umbraco
Applications
1 69 (8.81%) Chatbot
2 7 (0.89%) Photoshop
3 6 (0.77%) Microsoft Office
4 5 (0.64%) Adobe Premiere
5 3 (0.38%) Adobe Creative Suite
6 2 (0.26%) Adobe Illustrator
6 2 (0.26%) Simulink
7 1 (0.13%) Adobe After Effects
7 1 (0.13%) Microsoft Excel
7 1 (0.13%) S-PLUS
Business Applications
1 2 (0.26%) Dynamics CRM
2 1 (0.13%) TrackWise
Cloud Services
1 84 (10.73%) Azure
2 39 (4.98%) AWS
3 29 (3.70%) GCP
4 28 (3.58%) Azure DevOps
5 21 (2.68%) Power Platform
6 17 (2.17%) SaaS
6 17 (2.17%) Vertex AI
7 14 (1.79%) Azure Data Factory
7 14 (1.79%) Salsify
7 14 (1.79%) Serverless
8 12 (1.53%) Azure Synapse Analytics
9 11 (1.40%) PaaS
9 11 (1.40%) Power Automate
10 10 (1.28%) Amazon S3
10 10 (1.28%) Azure Monitor
11 9 (1.15%) AWS Lambda
11 9 (1.15%) Azure Service Bus
12 7 (0.89%) AWS Step Functions
12 7 (0.89%) IBM Watson
13 6 (0.77%) IaaS
Communications & Networking
1 57 (7.28%) Broadband
2 10 (1.28%) Firewall
3 8 (1.02%) Network Security
4 7 (0.89%) WAN
5 6 (0.77%) TCP/IP
6 5 (0.64%) SD-WAN
7 4 (0.51%) DNS
7 4 (0.51%) VPN
8 2 (0.26%) MQTT
9 1 (0.13%) Ethernet
9 1 (0.13%) Internet
9 1 (0.13%) NGN
9 1 (0.13%) Wi-Fi
9 1 (0.13%) Wireless
Database & Business Intelligence
1 27 (3.45%) Big Data
2 25 (3.19%) NoSQL
3 24 (3.07%) Data Mining
4 20 (2.55%) Power BI
5 18 (2.30%) Metadata
6 17 (2.17%) Data Lake
6 17 (2.17%) SQL Server
7 13 (1.66%) Hadoop
8 11 (1.40%) MySQL
9 10 (1.28%) Data Warehouse
10 8 (1.02%) DynamoDB
11 7 (0.89%) Elasticsearch
11 7 (0.89%) MongoDB
11 7 (0.89%) PostgreSQL
11 7 (0.89%) QlikView
12 5 (0.64%) Tableau
13 4 (0.51%) Redis
13 4 (0.51%) Relational Database
14 3 (0.38%) Pinecone
14 3 (0.38%) Weaviate
Development Applications
1 34 (4.34%) JIRA
2 26 (3.32%) Git
3 8 (1.02%) Cypress.io
4 6 (0.77%) Selenium
5 4 (0.51%) MLflow
5 4 (0.51%) SoapUI
5 4 (0.51%) Vite
5 4 (0.51%) webpack
6 3 (0.38%) Jenkins
7 2 (0.26%) Babel
7 2 (0.26%) JMeter
7 2 (0.26%) Robot Framework
8 1 (0.13%) Carbide.c++
8 1 (0.13%) GitLab
General
1 286 (36.53%) Retail
2 260 (33.21%) Manufacturing
3 158 (20.18%) Social Skills
4 126 (16.09%) Analytical Skills
5 106 (13.54%) Law
6 93 (11.88%) Inclusion and Diversity
7 80 (10.22%) Marketing
8 66 (8.43%) Finance
9 64 (8.17%) Dutch Language
9 64 (8.17%) Finnish Language
9 64 (8.17%) Norwegian Language
10 34 (4.34%) Public Sector
11 32 (4.09%) Games
12 31 (3.96%) Legal
13 17 (2.17%) Advertising
13 17 (2.17%) Telecoms
14 16 (2.04%) Catalan Language
15 14 (1.79%) Aviation
16 8 (1.02%) Banking
17 7 (0.89%) Local Government
Job Titles
1 300 (38.31%) Trainer
2 145 (18.52%) Senior
3 73 (9.32%) Lead
4 52 (6.64%) Developer
5 45 (5.75%) Sales Executive
6 37 (4.73%) Senior Manager
7 34 (4.34%) DevOps Engineer
8 33 (4.21%) Software Engineer
9 30 (3.83%) Embedded Engineer
9 30 (3.83%) Graduate
9 30 (3.83%) Graduate Sales Executive
10 25 (3.19%) Data Analytics Director
10 25 (3.19%) Release Engineer
11 20 (2.55%) Senior Developer
12 19 (2.43%) Azure DevOps Engineer
12 19 (2.43%) Azure Engineer
12 19 (2.43%) Head of Analytics
13 18 (2.30%) Head of AI
14 15 (1.92%) Account Manager
14 15 (1.92%) Corporate Sales Executive
Libraries, Frameworks & Software Standards
1 43 (5.49%) React
2 34 (4.34%) GraphQL
3 32 (4.09%) HTML
4 30 (3.83%) .NET
5 26 (3.32%) Unity (Game Engine)
6 25 (3.19%) Middleware
6 25 (3.19%) WebGL
7 13 (1.66%) CSS
7 13 (1.66%) Kafka
8 11 (1.40%) PyTorch
8 11 (1.40%) TensorFlow
9 10 (1.28%) HTML5
9 10 (1.28%) Jest
10 8 (1.02%) REST
11 7 (0.89%) .NET Framework
11 7 (0.89%) Node.js
11 7 (0.89%) Serverless Framework
12 6 (0.77%) Hugging Face
12 6 (0.77%) LangChain
13 5 (0.64%) Next.js
Miscellaneous
1 270 (34.48%) Robotics
2 48 (6.13%) Algorithms
3 45 (5.75%) Hybrid Cloud
4 42 (5.36%) e-Learning
5 34 (4.34%) Data Centre
5 34 (4.34%) Management Information System
6 29 (3.70%) Animation
7 26 (3.32%) Embedded Systems
8 21 (2.68%) Digital Media
9 16 (2.04%) FMCG
10 15 (1.92%) Cloud Native
10 15 (1.92%) Marketing Technology
11 14 (1.79%) Taxonomies
12 11 (1.40%) Onboarding
13 10 (1.28%) Social Media
14 8 (1.02%) Product Ownership
15 7 (0.89%) Blockchain
15 7 (0.89%) Greenfield Project
16 6 (0.77%) Public Cloud
17 5 (0.64%) Distributed Systems
Operating Systems
1 13 (1.66%) Windows
2 10 (1.28%) Linux
3 7 (0.89%) Android
4 6 (0.77%) Apple iOS
5 3 (0.38%) Windows Server
6 1 (0.13%) Mac OS
6 1 (0.13%) Robot Operating System
6 1 (0.13%) Unix
Processes & Methodologies
1 396 (50.57%) Machine Learning
2 350 (44.70%) Problem-Solving
3 298 (38.06%) Generative AI
4 277 (35.38%) LLM
5 240 (30.65%) Red Team
6 216 (27.59%) Data Privacy
7 170 (21.71%) Agile
8 130 (16.60%) Analytics
9 105 (13.41%) Roadmaps
10 98 (12.52%) DevOps
11 97 (12.39%) Strategic Thinking
12 74 (9.45%) CI/CD
13 69 (8.81%) Computer Science
13 69 (8.81%) Conversational UI
13 69 (8.81%) Data Science
13 69 (8.81%) Mentoring
14 64 (8.17%) Decision-Making
15 61 (7.79%) Software Engineering
16 58 (7.41%) Coaching
17 54 (6.90%) Chemistry
Programming Languages
1 69 (8.81%) Python
2 56 (7.15%) JavaScript
3 49 (6.26%) C#
3 49 (6.26%) SQL
4 44 (5.62%) TypeScript
5 32 (4.09%) C++
5 32 (4.09%) Java
6 26 (3.32%) R
7 25 (3.19%) HLSL
8 21 (2.68%) C
9 20 (2.55%) Rust
10 19 (2.43%) PHP
11 18 (2.30%) MATLAB
11 18 (2.30%) Ruby
12 16 (2.04%) Dart
13 9 (1.15%) Bicep
13 9 (1.15%) Go
14 7 (0.89%) PowerShell
14 7 (0.89%) VB.NET
15 5 (0.64%) Shell Script
Qualifications
1 420 (53.64%) Degree
2 84 (10.73%) Master's Degree
3 57 (7.28%) Computer Science Degree
4 55 (7.02%) PhD
5 42 (5.36%) Security Cleared
6 35 (4.47%) SC Cleared
7 24 (3.07%) DV Cleared
8 16 (2.04%) AWS Certification
9 13 (1.66%) Azure Certification
10 5 (0.64%) DBS Check
10 5 (0.64%) MBA
11 4 (0.51%) Numerate Degree
12 2 (0.26%) CCFP
12 2 (0.26%) EnCE
12 2 (0.26%) GCFA
12 2 (0.26%) GCFE
12 2 (0.26%) GREM
12 2 (0.26%) ISTQB
12 2 (0.26%) ISTQB Foundation Certification
12 2 (0.26%) PRINCE2 Practitioner
Quality Assurance & Compliance
1 36 (4.60%) Accessibility
2 21 (2.68%) Data Quality
3 11 (1.40%) QA
4 10 (1.28%) ISO/IEC 27001
5 9 (1.15%) California Consumer Privacy Act
5 9 (1.15%) GDPR
6 6 (0.77%) Cyber Essentials
6 6 (0.77%) Cyber Essentials PLUS
7 3 (0.38%) GxP
7 3 (0.38%) WCAG
8 2 (0.26%) Dublin Core
8 2 (0.26%) GMP
8 2 (0.26%) SOC 2
9 1 (0.13%) GLP
9 1 (0.13%) ISO 9001
System Software
1 27 (3.45%) Docker
2 6 (0.77%) Virtual Machines
3 4 (0.51%) HDFS
4 3 (0.38%) VMware ESXi
4 3 (0.38%) VMware Infrastructure
Systems Management
1 35 (4.47%) Kubernetes
2 7 (0.89%) Grafana
2 7 (0.89%) Prometheus
3 6 (0.77%) ArcSight ESM
3 6 (0.77%) QRadar
3 6 (0.77%) Terraform
4 4 (0.51%) Single Sign-On
5 3 (0.38%) Ansible
5 3 (0.38%) Kubeflow
6 2 (0.26%) EnCase
6 2 (0.26%) FTK
6 2 (0.26%) Hadoop YARN
6 2 (0.26%) RSA Security Analytics
Vendors
1 274 (34.99%) Google
2 267 (34.10%) Databricks
3 250 (31.93%) Adobe
4 75 (9.58%) Microsoft
5 61 (7.79%) PayPal
6 50 (6.39%) IBM
7 42 (5.36%) Red Hat
8 22 (2.81%) Cisco
8 22 (2.81%) OpenAI
9 21 (2.68%) Dell
10 12 (1.53%) Oracle
11 8 (1.02%) Splunk
11 8 (1.02%) UiPath
12 7 (0.89%) Informatica
13 6 (0.77%) ArcSight
13 6 (0.77%) LogLogic
13 6 (0.77%) McAfee
13 6 (0.77%) NetApp
14 4 (0.51%) Twitter
14 4 (0.51%) YouTube