Cybersecurity Jobs in the South East

Cybersecurity
England > South East

The table below provides summary statistics for permanent job vacancies advertised in the South East requiring Cybersecurity skills. It includes a benchmarking guide to the annual salaries offered in vacancies that cited Cybersecurity over the 6 months leading up to 19 June 2025, comparing them to the same period in the previous two years.

6 months to
19 Jun 2025
Same period 2024 Same period 2023
Rank 31 32 49
Rank change year-on-year +1 +17 +6
Permanent jobs citing Cybersecurity 629 1,017 712
As % of all permanent jobs advertised in the South East 6.56% 5.37% 5.41%
As % of the Processes & Methodologies category 7.17% 6.60% 5.74%
Number of salaries quoted 429 642 400
10th Percentile £26,250 £37,500 £31,250
25th Percentile £37,500 £41,322 £42,500
Median annual salary (50th Percentile) £47,683 £50,500 £55,050
Median % change year-on-year -5.58% -8.27% -8.25%
75th Percentile £63,750 £63,750 £70,313
90th Percentile £76,199 £74,875 £90,000
England median annual salary £53,844 £57,500 £64,750
% change year-on-year -6.36% -11.20% -0.38%

All Process and Methodology Skills
South East

Cybersecurity falls under the Processes and Methodologies category. For comparison with the information above, the following table provides summary statistics for all permanent job vacancies requiring process or methodology skills in the South East.

Permanent vacancies with a requirement for process or methodology skills 8,771 15,415 12,408
As % of all permanent jobs advertised in the South East 91.49% 81.41% 94.31%
Number of salaries quoted 4,359 10,531 7,512
10th Percentile £28,500 £28,000 £30,638
25th Percentile £37,500 £37,500 £41,250
Median annual salary (50th Percentile) £55,000 £50,000 £55,000
Median % change year-on-year +10.00% -9.09% -
75th Percentile £70,000 £65,000 £72,500
90th Percentile £80,000 £78,268 £85,000
England median annual salary £57,500 £55,000 £62,500
% change year-on-year +4.55% -12.00% +4.17%

Cybersecurity
Job Vacancy Trend in the South East

Job postings citing Cybersecurity as a proportion of all IT jobs advertised in the South East.
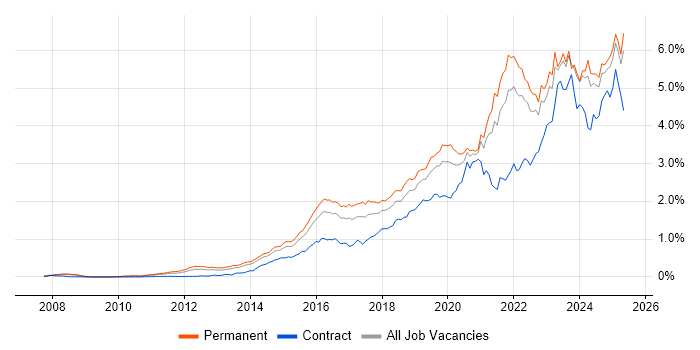
Job vacancy trend for Cybersecurity in the South East

Cybersecurity
Salary Trend in the South East

3-month moving average salary quoted in jobs citing Cybersecurity in the South East.

Salary trend for Cybersecurity in the South East

Cybersecurity
Salary Histogram in the South East

Salary distribution for jobs citing Cybersecurity in the South East over the 6 months to 19 June 2025.

Salary histogram for Cybersecurity in the South East

Cybersecurity
Job Locations in the South East

The table below looks at the demand and provides a guide to the median salaries quoted in IT jobs citing Cybersecurity within the South East region over the 6 months to 19 June 2025. The 'Rank Change' column provides an indication of the change in demand within each location based on the same 6 month period last year.

Location Rank Change
on Same Period
Last Year
Matching
Permanent
IT Job Ads
Median Salary
Past 6 Months
Median Salary
% Change
on Same Period
Last Year
Live
Jobs
Hampshire +38 167 £47,683 -13.30% 339
Thames Valley -46 131 £42,000 -16.00% 661
Surrey +12 114 £55,000 +8.91% 187
Kent +32 71 £55,000 +17.65% 147
Isle of Wight - 60 £47,683 - 2
Oxfordshire +49 51 £60,000 +41.18% 119
Buckinghamshire -38 43 £25,500 -49.00% 164
Middlesex +2 40 - - 2
Berkshire -40 37 £42,500 -19.12% 383
West Sussex +22 22 £53,750 -2.27% 111
East Sussex +35 20 £35,000 -22.22% 75
Sussex +18 2 - - 23
Cybersecurity
England

Cybersecurity
Co-occurring Skills and Capabilities in the South East by Category

The follow tables expand on the table above by listing co-occurrences grouped by category. The same employment type, locality and period is covered with up to 20 co-occurrences shown in each of the following categories:

Application Platforms
1 22 (3.50%) Microsoft Exchange
2 20 (3.18%) SharePoint
3 5 (0.79%) Apache
3 5 (0.79%) IIS
4 2 (0.32%) Confluence
4 2 (0.32%) TPMS
Applications
1 20 (3.18%) Microsoft Office
2 17 (2.70%) Simulink
3 2 (0.32%) Adobe Creative Suite
3 2 (0.32%) Microsoft Excel
4 1 (0.16%) AutoCAD
4 1 (0.16%) Microsoft PowerPoint
4 1 (0.16%) OrCAD
4 1 (0.16%) Revit
Business Applications
1 15 (2.38%) Dynamics CRM
2 3 (0.48%) Salesforce CRM
3 1 (0.16%) Elite 3E
3 1 (0.16%) NetSuite
3 1 (0.16%) Sparx Enterprise Architect
Cloud Services
1 79 (12.56%) Azure
2 69 (10.97%) Microsoft 365
3 41 (6.52%) AWS
4 24 (3.82%) Entra ID
5 22 (3.50%) PaaS
6 17 (2.70%) Azure DevOps
6 17 (2.70%) Power Platform
7 14 (2.23%) Dynamics 365
8 13 (2.07%) Azure Sentinel
9 12 (1.91%) PowerApps
10 11 (1.75%) AWS Lambda
10 11 (1.75%) Serverless
11 10 (1.59%) SaaS
12 7 (1.11%) Cloud Computing
12 7 (1.11%) GCP
12 7 (1.11%) Power Automate
13 6 (0.95%) IaaS
14 3 (0.48%) Nutanix
15 2 (0.32%) Google Workspace
15 2 (0.32%) OneDrive
Communications & Networking
1 52 (8.27%) Firewall
2 32 (5.09%) TCP/IP
3 23 (3.66%) Network Security
4 19 (3.02%) DNS
4 19 (3.02%) SSL
5 16 (2.54%) VoIP
5 16 (2.54%) VPN
6 12 (1.91%) SNMP
7 11 (1.75%) Broadband
7 11 (1.75%) SAN
7 11 (1.75%) SSH
8 9 (1.43%) WAN
9 8 (1.27%) DHCP
10 7 (1.11%) Intrusion Detection
10 7 (1.11%) Modbus
10 7 (1.11%) VLAN
11 6 (0.95%) Ethernet
11 6 (0.95%) MQTT
11 6 (0.95%) NAS
11 6 (0.95%) Wi-Fi
Database & Business Intelligence
1 11 (1.75%) MongoDB
1 11 (1.75%) SQL Server
2 7 (1.11%) PostgreSQL
3 6 (0.95%) Power BI
4 5 (0.79%) Relational Database
5 4 (0.64%) Data Warehouse
6 2 (0.32%) Big Data
7 1 (0.16%) MySQL
7 1 (0.16%) NoSQL
Development Applications
1 35 (5.56%) Rational DOORS
2 20 (3.18%) JIRA
3 2 (0.32%) Babel
3 2 (0.32%) Bitbucket
3 2 (0.32%) Mocha
3 2 (0.32%) rollup.js
3 2 (0.32%) webpack
4 1 (0.16%) Burp Suite
4 1 (0.16%) CMake
4 1 (0.16%) Git
4 1 (0.16%) LabVIEW
4 1 (0.16%) Metasploit
4 1 (0.16%) Subversion
General
1 207 (32.91%) Social Skills
2 109 (17.33%) Presentation Skills
3 62 (9.86%) Inclusion and Diversity
4 59 (9.38%) Legal
5 49 (7.79%) Law
6 45 (7.15%) Finance
7 26 (4.13%) Analytical Skills
8 23 (3.66%) Military
9 22 (3.50%) Public Sector
10 18 (2.86%) Aerospace
11 17 (2.70%) Electronics
12 16 (2.54%) Telecoms
13 13 (2.07%) Marketing
14 12 (1.91%) Manufacturing
15 11 (1.75%) Pharmaceutical
16 9 (1.43%) Organisational Skills
17 8 (1.27%) Aviation
18 7 (1.11%) Retail
19 6 (0.95%) Local Government
20 5 (0.79%) Back Office
Job Titles
1 126 (20.03%) Systems Engineer
2 59 (9.38%) Analyst
3 50 (7.95%) Lead
4 45 (7.15%) Security Engineer
5 42 (6.68%) Senior
6 39 (6.20%) IT Support
7 34 (5.41%) Graduate
7 34 (5.41%) Sales Executive
8 30 (4.77%) Graduate Sales Executive
9 27 (4.29%) Security Analyst
10 23 (3.66%) Vulnerability Manager
11 22 (3.50%) Cybersecurity Engineer
12 21 (3.34%) Developer
13 20 (3.18%) Security Manager
14 18 (2.86%) IT Technician
14 18 (2.86%) System Design Authority
15 17 (2.70%) Senior Systems Engineer
15 17 (2.70%) Support Technician
16 15 (2.38%) Field Engineer
16 15 (2.38%) IT Manager
Libraries, Frameworks & Software Standards
1 16 (2.54%) YAML
2 15 (2.38%) Web Services
3 11 (1.75%) RESTful
4 10 (1.59%) Kafka
5 5 (0.79%) .NET
5 5 (0.79%) CSS
6 4 (0.64%) React
7 3 (0.48%) AngularJS
7 3 (0.48%) HTML
7 3 (0.48%) LDAP
7 3 (0.48%) SAML
7 3 (0.48%) Vue
8 2 (0.32%) Jest
8 2 (0.32%) Leaflet
8 2 (0.32%) LESS
8 2 (0.32%) Sass
9 1 (0.16%) Bazel
9 1 (0.16%) Node.js
9 1 (0.16%) RabbitMQ
9 1 (0.16%) Spring Boot
Miscellaneous
1 80 (12.72%) Management Information System
2 73 (11.61%) Data Centre
3 57 (9.06%) Cyberattack
4 52 (8.27%) Security Posture
5 32 (5.09%) Cyber Threat
6 25 (3.97%) Driving Licence
6 25 (3.97%) Onboarding
7 19 (3.02%) Security Operations Centre
8 18 (2.86%) PKI
9 17 (2.70%) Operational Technology
10 14 (2.23%) Self-Motivation
11 12 (1.91%) Data Protection Act
12 11 (1.75%) Social Media
13 9 (1.43%) Cyber Security Posture
14 7 (1.11%) Greenfield Project
14 7 (1.11%) SCADA
15 6 (0.95%) Clustering
15 6 (0.95%) IoT
15 6 (0.95%) LIMS
15 6 (0.95%) Robotics
Operating Systems
1 85 (13.51%) Windows
2 25 (3.97%) Linux
3 23 (3.66%) Windows Server
4 16 (2.54%) Windows 10
5 13 (2.07%) Unix
6 10 (1.59%) Apple iOS
7 9 (1.43%) Mac OS
8 8 (1.27%) Red Hat Enterprise Linux
9 6 (0.95%) Android
10 2 (0.32%) Windows Vista
11 1 (0.16%) Ubuntu
11 1 (0.16%) Windows Server 2016
11 1 (0.16%) Windows Server 2019
Processes & Methodologies
1 183 (29.09%) Agile
2 149 (23.69%) Systems Engineering
3 117 (18.60%) SysML
4 105 (16.69%) MODAF
4 105 (16.69%) UML
5 92 (14.63%) Problem-Solving
6 74 (11.76%) Incident Response
6 74 (11.76%) Mentoring
7 73 (11.61%) Information Security
8 72 (11.45%) Continuous Improvement
9 67 (10.65%) Customer Service
10 62 (9.86%) Creative Thinking
11 58 (9.22%) Vulnerability Management
12 56 (8.90%) Coaching
13 55 (8.74%) Computer Science
14 52 (8.27%) Line Management
15 45 (7.15%) SIEM
16 44 (7.00%) Artificial Intelligence
17 43 (6.84%) Roadmaps
17 43 (6.84%) Stakeholder Management
Programming Languages
1 121 (19.24%) MATLAB
2 39 (6.20%) PowerShell
3 36 (5.72%) Python
4 20 (3.18%) SQL
5 18 (2.86%) C#
6 9 (1.43%) Kusto Query Language
7 7 (1.11%) Bash
7 7 (1.11%) C
7 7 (1.11%) C++
8 6 (0.95%) JavaScript
9 4 (0.64%) TypeScript
9 4 (0.64%) Uniface
10 1 (0.16%) Embedded C
10 1 (0.16%) Embedded C++
10 1 (0.16%) Go
10 1 (0.16%) Groovy
10 1 (0.16%) Java
10 1 (0.16%) Rust
Qualifications
1 263 (41.81%) Degree
2 136 (21.62%) BPSS Clearance
3 71 (11.29%) Security Cleared
4 52 (8.27%) CISSP
5 36 (5.72%) Computer Science Degree
6 35 (5.56%) SC Cleared
7 32 (5.09%) CISM
8 29 (4.61%) DV Cleared
9 24 (3.82%) Chartered Engineer
10 18 (2.86%) Master's Degree
11 13 (2.07%) Microsoft Certification
12 12 (1.91%) CEH
12 12 (1.91%) HND
13 11 (1.75%) Cisco Certification
13 11 (1.75%) CRISC
13 11 (1.75%) OSCP
14 10 (1.59%) CISA
15 9 (1.43%) CompTIA Security+
16 8 (1.27%) CCNA
16 8 (1.27%) GCIH
Quality Assurance & Compliance
1 91 (14.47%) ISO/IEC 27001
2 68 (10.81%) NIST
3 58 (9.22%) NCSC
4 47 (7.47%) Cyber Essentials
5 31 (4.93%) Cyber Essentials PLUS
6 30 (4.77%) GDPR
7 12 (1.91%) PCI DSS
8 11 (1.75%) HIPAA
9 9 (1.43%) Def Stans
10 8 (1.27%) ISO/IEC 27002 (supersedes ISO/IEC 17799)
11 7 (1.11%) PMO
12 6 (0.95%) GLP
12 6 (0.95%) SLA
13 4 (0.64%) GRC
13 4 (0.64%) QA
14 3 (0.48%) COSHH
14 3 (0.48%) Sarbanes-Oxley
15 2 (0.32%) ISO 31000
15 2 (0.32%) NIST 800
15 2 (0.32%) SOC 2
System Software
1 50 (7.95%) Active Directory
2 31 (4.93%) VMware Infrastructure
3 19 (3.02%) Virtual Machines
4 10 (1.59%) Hyper-V
5 6 (0.95%) VMware ESXi
5 6 (0.95%) vSphere
6 4 (0.64%) Docker
7 1 (0.16%) Firmware
7 1 (0.16%) Virtual Servers
7 1 (0.16%) XenApp
Systems Management
1 14 (2.23%) Microsoft Intune
1 14 (2.23%) Terraform
2 12 (1.91%) QRadar
3 6 (0.95%) ArcSight ESM
3 6 (0.95%) Functional Safety
4 5 (0.79%) CASB
4 5 (0.79%) FortiGate
4 5 (0.79%) SCCM
4 5 (0.79%) ZABBIX
5 4 (0.64%) Kubernetes
6 2 (0.32%) Active Directory Federation Services
6 2 (0.32%) Computer Incident Response Team
6 2 (0.32%) EnCase
6 2 (0.32%) FTK
6 2 (0.32%) Jamf Pro
6 2 (0.32%) RSA Security Analytics
6 2 (0.32%) Single Sign-On
7 1 (0.16%) Ansible
7 1 (0.16%) McAfee ePO
7 1 (0.16%) Nessus
Vendors
1 171 (27.19%) Microsoft
2 49 (7.79%) VMware
3 27 (4.29%) Cisco
4 23 (3.66%) Siemens
5 21 (3.34%) IBM
6 19 (3.02%) Splunk
6 19 (3.02%) Tenable
7 17 (2.70%) Qualys
8 15 (2.38%) Thales
9 10 (1.59%) Apple
10 9 (1.43%) Sophos
11 8 (1.27%) ArcSight
11 8 (1.27%) Palo Alto
11 8 (1.27%) Progress
11 8 (1.27%) Salesforce
12 7 (1.11%) McAfee
13 6 (0.95%) Adobe
13 6 (0.95%) AVEVA
13 6 (0.95%) LogLogic
13 6 (0.95%) WatchGuard