Azure DevOps Job Trends in the South East

Microsoft Azure DevOps
England > South East

The table below provides summary statistics and salary benchmarking for jobs advertised in the South East requiring Azure DevOps skills. It covers permanent job vacancies from the 6 months leading up to 24 November 2025, with comparisons to the same periods in the previous two years.

6 months to
24 Nov 2025
Same period 2024 Same period 2023
Rank 97 97 116
Rank change year-on-year 0 +19 -28
Permanent jobs citing Azure DevOps 231 304 191
As % of all permanent jobs in the South East 2.46% 2.69% 2.53%
As % of the Cloud Services category 7.74% 8.83% 6.92%
Number of salaries quoted 127 210 149
10th Percentile £32,500 £42,500 £46,490
25th Percentile £42,500 £51,438 £52,500
Median annual salary (50th Percentile) £60,000 £67,500 £65,000
Median % change year-on-year -11.11% +3.85% -
75th Percentile £77,500 £82,500 £77,500
90th Percentile £87,500 £83,750 £95,000
England median annual salary £65,250 £67,500 £65,000
% change year-on-year -3.33% +3.85% -2.67%

All Cloud Skills
South East

Azure DevOps falls under the Cloud Services category. For comparison with the information above, the following table provides summary statistics for all permanent job vacancies requiring cloud computing skills in the South East.

Permanent vacancies with a requirement for cloud computing skills 2,983 3,441 2,760
As % of all permanent jobs advertised in the South East 31.83% 30.41% 36.49%
Number of salaries quoted 1,717 1,912 2,271
10th Percentile £28,000 £33,525 £29,000
25th Percentile £34,000 £43,438 £40,000
Median annual salary (50th Percentile) £47,500 £58,500 £53,500
Median % change year-on-year -18.80% +9.35% -6.96%
75th Percentile £67,500 £75,000 £69,500
90th Percentile £85,000 £86,250 £82,500
England median annual salary £58,000 £65,000 £62,500
% change year-on-year -10.77% +4.00% -3.85%

Azure DevOps
Job Vacancy Trend in the South East

Historical trend showing the proportion of permanent IT job postings citing Azure DevOps relative to all permanent IT jobs advertised in the South East.
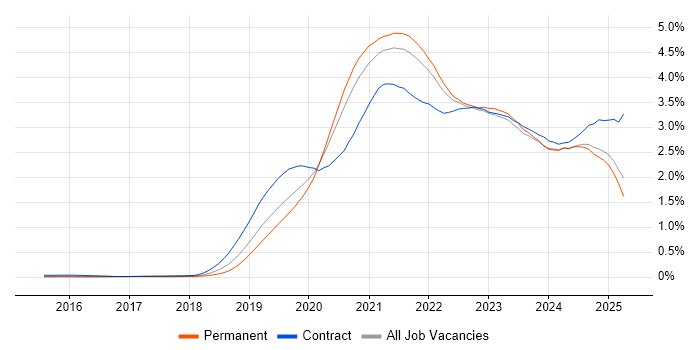
Azure DevOps job vacancy trend in the South East

Azure DevOps
Salary Trend in the South East

Salary distribution trend for jobs in the South East citing Azure DevOps.

Salary distribution trend for jobs in the South East citing Azure DevOps

Azure DevOps
Salary Histogram in the South East

Salary distribution for jobs citing Azure DevOps in the South East over the 6 months to 24 November 2025.

Salary histogram for Azure DevOps in the South East

Azure DevOps
Job Locations in the South East

The table below looks at the demand and provides a guide to the median salaries quoted in IT jobs citing Azure DevOps within the South East region over the 6 months to 24 November 2025. The 'Rank Change' column provides an indication of the change in demand within each location based on the same 6 month period last year.

Location Rank Change
on Same Period
Last Year
Matching
Permanent
IT Job Ads
Median Salary
Past 6 Months
Median Salary
% Change
on Same Period
Last Year
Live
Jobs
Thames Valley +13 114 £65,000 -3.70% 19
Berkshire +11 81 £82,500 +10.00% 5
Hampshire +23 40 £62,500 +4.17% 8
Buckinghamshire +9 27 £47,000 -21.67% 7
Middlesex +16 21 £37,500 - 1
Surrey -48 17 £67,500 -6.90% 2
West Sussex +11 15 £60,000 - 4
East Sussex +12 10 £56,500 +13.00% 6
Kent -1 9 £37,500 -46.43% 8
Oxfordshire +28 6 £50,000 -22.48% 8
Sussex - 4 £45,000 - 4
Isle of Wight - 3 £42,500 -
Azure DevOps
England

Azure DevOps
Co-Occurring Skills & Capabilities in the South East by Category

The following tables expand on the one above by listing co-occurrences grouped by category. They cover the same employment type, locality and period, with up to 20 co-occurrences shown in each category:

Application Platforms
1 20 (8.66%) IIS
2 7 (3.03%) Apache Airflow
3 6 (2.60%) Appian
4 5 (2.16%) Apache
5 4 (1.73%) nginx
5 4 (1.73%) SharePoint
6 3 (1.30%) Confluence
7 1 (0.43%) Apache Spark
Applications
1 15 (6.49%) Microsoft Office
2 4 (1.73%) Microsoft Excel
2 4 (1.73%) Microsoft PowerPoint
2 4 (1.73%) Microsoft Project
3 1 (0.43%) Photoshop
Business Applications
1 69 (29.87%) SAP S/4HANA
2 6 (2.60%) Dynamics CRM
Cloud Services
1 162 (70.13%) Azure
2 30 (12.99%) GitHub
3 28 (12.12%) Power Platform
4 24 (10.39%) AWS
5 20 (8.66%) GitHub Actions
6 13 (5.63%) Dynamics 365
7 12 (5.19%) Azure Service Bus
8 11 (4.76%) PaaS
9 10 (4.33%) Microsoft 365
10 9 (3.90%) Azure Cosmos DB
11 8 (3.46%) Entra ID
11 8 (3.46%) GCP
12 7 (3.03%) Azure Data Factory
12 7 (3.03%) Azure Monitor
13 6 (2.60%) Amazon S3
13 6 (2.60%) Azure Key Vault
13 6 (2.60%) MinIO
13 6 (2.60%) SaaS
14 5 (2.16%) Cloudflare
14 5 (2.16%) SonarCloud
Communications & Networking
1 10 (4.33%) DNS
2 3 (1.30%) VPN
3 2 (0.87%) Firewall
4 1 (0.43%) AMQP
4 1 (0.43%) HTTP
4 1 (0.43%) HTTPS
4 1 (0.43%) Network Security
4 1 (0.43%) SSL
4 1 (0.43%) TCP/IP
Database & Business Intelligence
1 33 (14.29%) SQL Server
2 19 (8.23%) Power BI
3 16 (6.93%) SQL Server Reporting Services
4 9 (3.90%) Azure SQL Database
5 5 (2.16%) Airbyte
5 5 (2.16%) Elasticsearch
6 4 (1.73%) SQL Server Integration Services
7 3 (1.30%) Relational Database
7 3 (1.30%) Tableau
8 2 (0.87%) Amazon Redshift
8 2 (0.87%) BigQuery
8 2 (0.87%) Data Hub
8 2 (0.87%) Data Warehouse
8 2 (0.87%) Looker
8 2 (0.87%) MySQL
8 2 (0.87%) SQL Server Analysis Services
9 1 (0.43%) Big Data
9 1 (0.43%) Metadata
9 1 (0.43%) MongoDB
9 1 (0.43%) Redis
Development Applications
1 76 (32.90%) JIRA
2 69 (29.87%) eCATT
3 39 (16.88%) Git
4 38 (16.45%) NeoLoad
5 22 (9.52%) Selenium
6 20 (8.66%) Robot Framework
7 19 (8.23%) Snyk
8 14 (6.06%) Jenkins
9 11 (4.76%) Octopus Deploy
10 8 (3.46%) Visual Studio
11 7 (3.03%) GitLab
12 6 (2.60%) MSBuild
13 5 (2.16%) Team Foundation Server
14 4 (1.73%) Storybook
15 2 (0.87%) Artifactory
15 2 (0.87%) Atlassian Bamboo
15 2 (0.87%) TestRail
16 1 (0.43%) Bitbucket
16 1 (0.43%) Cypress.io
16 1 (0.43%) Maven
General
1 114 (49.35%) Finance
2 72 (31.17%) Manufacturing
3 71 (30.74%) Marketing
4 50 (21.65%) Presentation Skills
5 41 (17.75%) Social Skills
6 40 (17.32%) Influencing Skills
7 29 (12.55%) Analytical Skills
8 7 (3.03%) Retail
9 5 (2.16%) Law
9 5 (2.16%) Legal
10 3 (1.30%) Aerospace
10 3 (1.30%) Military
10 3 (1.30%) Public Sector
11 2 (0.87%) Banking
12 1 (0.43%) Advertising
12 1 (0.43%) Documentation Skills
12 1 (0.43%) Financial Institution
12 1 (0.43%) Inclusion and Diversity
12 1 (0.43%) International Banking
12 1 (0.43%) Organisational Skills
Job Titles
1 65 (28.14%) Analyst
2 64 (27.71%) Lead
3 46 (19.91%) Senior
4 31 (13.42%) Test Leader
5 30 (12.99%) Test Analyst
6 21 (9.09%) Automation Test Lead
7 20 (8.66%) Software Engineer
8 19 (8.23%) DevOps Engineer
9 16 (6.93%) Developer
10 14 (6.06%) IT Engineer
11 13 (5.63%) IT Support
11 13 (5.63%) IT Support Engineer
11 13 (5.63%) Support Engineer
12 12 (5.19%) Performance Analyst
12 12 (5.19%) Performance Test Analyst
12 12 (5.19%) Software Support Engineer
12 12 (5.19%) Testing Analyst
13 11 (4.76%) Architect
13 11 (4.76%) Platform Engineer
14 10 (4.33%) Performance Test Leader
Libraries, Frameworks & Software Standards
1 59 (25.54%) .NET
2 17 (7.36%) .NET Framework
2 17 (7.36%) ASP.NET
3 12 (5.19%) Entity Framework
3 12 (5.19%) WinForms
4 10 (4.33%) ARM Templates
5 9 (3.90%) Next.js
5 9 (3.90%) React
6 8 (3.46%) CSS
6 8 (3.46%) HTML
6 8 (3.46%) JSON
6 8 (3.46%) REST
7 7 (3.03%) Bootstrap
7 7 (3.03%) Kafka
7 7 (3.03%) YAML
8 6 (2.60%) .NET Core
8 6 (2.60%) Apache NiFi
8 6 (2.60%) XML
9 5 (2.16%) gRPC
9 5 (2.16%) RESTful
Miscellaneous
1 24 (10.39%) Cloud Native
2 23 (9.96%) Product Ownership
3 14 (6.06%) Onboarding
4 10 (4.33%) Security Posture
5 7 (3.03%) Low-Code
6 6 (2.60%) Linux Command Line
6 6 (2.60%) Mobile App
7 4 (1.73%) Analytical Mindset
8 3 (1.30%) Life Science
8 3 (1.30%) Operational Technology
8 3 (1.30%) SCADA
9 2 (0.87%) Clustering
9 2 (0.87%) Data Centre
9 2 (0.87%) Distributed Systems
9 2 (0.87%) Legacy Systems
9 2 (0.87%) Marketing Technology
9 2 (0.87%) Renewable Energy
10 1 (0.43%) Enterprise Software
10 1 (0.43%) Greenfield Project
10 1 (0.43%) Management Information System
Operating Systems
1 41 (17.75%) Windows
2 17 (7.36%) Linux
3 7 (3.03%) VMS
4 4 (1.73%) Android
4 4 (1.73%) Apple iOS
5 2 (0.87%) Ubuntu
6 1 (0.43%) Red Hat Enterprise Linux
Processes & Methodologies
1 162 (70.13%) DevOps
2 93 (40.26%) Agile
3 91 (39.39%) Test Management
4 84 (36.36%) CI/CD
5 70 (30.30%) Roadmaps
6 69 (29.87%) Source to Pay
7 67 (29.00%) Continuous Improvement
7 67 (29.00%) Test Automation
8 56 (24.24%) ERP
9 51 (22.08%) Product Roadmap
9 51 (22.08%) Visualisation
10 48 (20.78%) Test Strategy
11 46 (19.91%) Mentoring
11 46 (19.91%) Problem-Solving
12 44 (19.05%) Performance Testing
13 43 (18.61%) Risk Management
14 38 (16.45%) Requirements Gathering
15 35 (15.15%) Continuous Delivery
16 34 (14.72%) Infrastructure as Code
16 34 (14.72%) Scrum
Programming Languages
1 62 (26.84%) SQL
2 50 (21.65%) C#
3 30 (12.99%) PowerShell
4 29 (12.55%) Python
5 15 (6.49%) Bash
6 14 (6.06%) T-SQL
7 13 (5.63%) JavaScript
8 8 (3.46%) TypeScript
9 6 (2.60%) Bicep
10 3 (1.30%) C++
10 3 (1.30%) Java
11 2 (0.87%) Data Analysis Expressions
12 1 (0.43%) Apex Code
12 1 (0.43%) Delphi
12 1 (0.43%) Go
12 1 (0.43%) Korn
12 1 (0.43%) Perl
12 1 (0.43%) R
12 1 (0.43%) VB
12 1 (0.43%) VBA
Qualifications
1 31 (13.42%) Degree
2 25 (10.82%) Security Cleared
3 20 (8.66%) Computer Science Degree
4 19 (8.23%) DV Cleared
5 14 (6.06%) ISTQB
6 12 (5.19%) ISEB
7 9 (3.90%) Azure Certification
8 8 (3.46%) SC Cleared
9 7 (3.03%) Master's Degree
10 4 (1.73%) PMI Certification
10 4 (1.73%) PMP
11 2 (0.87%) ISTQB Foundation Certification
11 2 (0.87%) Microsoft Certification
12 1 (0.43%) ITIL Foundation Certificate
12 1 (0.43%) TOGAF Certification
Quality Assurance & Compliance
1 54 (23.38%) QA
2 12 (5.19%) PMO
3 9 (3.90%) GDPR
3 9 (3.90%) Software Quality Assurance
4 7 (3.03%) ISO/IEC 27001
4 7 (3.03%) NCSC
4 7 (3.03%) NIST
5 4 (1.73%) Accessibility
6 1 (0.43%) Data Quality
6 1 (0.43%) HIPAA
System Software
1 24 (10.39%) Docker
2 7 (3.03%) Active Directory
2 7 (3.03%) Virtual Machines
3 2 (0.87%) VMware Infrastructure
4 1 (0.43%) Apache ZooKeeper
4 1 (0.43%) Virtual Desktop
Systems Management
1 69 (29.87%) HP ALM
2 39 (16.88%) Terraform
3 29 (12.55%) Kubernetes
4 20 (8.66%) Ansible
5 7 (3.03%) Grafana
5 7 (3.03%) Prometheus
6 3 (1.30%) Microsoft Intune
7 2 (0.87%) Nessus
8 1 (0.43%) Proxmox
Vendors
1 69 (29.87%) HP
1 69 (29.87%) SAP
2 62 (26.84%) Microsoft
3 18 (7.79%) Black Duck
4 17 (7.36%) Coverity
5 12 (5.19%) Sage
5 12 (5.19%) Xamarin
6 9 (3.90%) Rackspace
7 8 (3.46%) Google
8 7 (3.03%) Databricks
8 7 (3.03%) VMware
8 7 (3.03%) Zoho
9 6 (2.60%) BiZZdesign
9 6 (2.60%) UiPath
10 5 (2.16%) Blue Prism
11 4 (1.73%) Salesforce
12 3 (1.30%) Oracle
12 3 (1.30%) Rockwell
12 3 (1.30%) Siemens
13 2 (0.87%) Talend