DevOps Job Trends in the South East

DevOps
England > South East

The table below provides summary statistics and salary benchmarking for jobs advertised in the South East requiring DevOps skills. It covers permanent job vacancies from the 6 months leading up to 28 November 2025, with comparisons to the same periods in the previous two years.

6 months to
28 Nov 2025
Same period 2024 Same period 2023
Rank 50 22 20
Rank change year-on-year -28 -2 -2
Permanent jobs citing DevOps 418 867 668
As % of all permanent jobs in the South East 4.38% 7.78% 8.97%
As % of the Processes & Methodologies category 5.22% 9.35% 9.65%
Number of salaries quoted 264 498 468
10th Percentile £33,750 £42,500 £46,600
25th Percentile £47,500 £50,750 £53,375
Median annual salary (50th Percentile) £65,000 £66,644 £65,000
Median % change year-on-year -2.47% +2.53% -
75th Percentile £83,750 £82,500 £77,500
90th Percentile £91,750 £87,500 £90,000
England median annual salary £70,000 £70,000 £70,000

All Process and Methodology Skills
South East

DevOps falls under the Processes and Methodologies category. For comparison with the information above, the following table provides summary statistics for all permanent job vacancies requiring process or methodology skills in the South East.

Permanent vacancies with a requirement for process or methodology skills 8,001 9,269 6,922
As % of all permanent jobs advertised in the South East 83.91% 83.14% 92.95%
Number of salaries quoted 4,871 4,839 4,851
10th Percentile £27,500 £32,750 £30,500
25th Percentile £33,750 £43,500 £40,000
Median annual salary (50th Percentile) £49,000 £56,430 £54,763
Median % change year-on-year -13.17% +3.04% -0.43%
75th Percentile £65,000 £72,500 £67,500
90th Percentile £80,000 £85,000 £82,500
England median annual salary £55,000 £60,000 £60,000
% change year-on-year -8.33% - -2.44%

DevOps
Job Vacancy Trend in the South East

Historical trend showing the proportion of permanent IT job postings citing DevOps relative to all permanent IT jobs advertised in the South East.
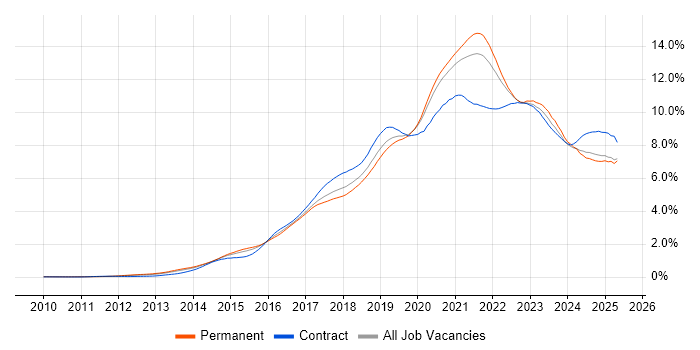
DevOps job vacancy trend in the South East

DevOps
Salary Trend in the South East

Salary distribution trend for jobs in the South East citing DevOps.

Salary distribution trend for jobs in the South East citing DevOps

DevOps
Salary Histogram in the South East

Salary distribution for jobs citing DevOps in the South East over the 6 months to 28 November 2025.

Salary histogram for DevOps in the South East

DevOps
Job Locations in the South East

The table below looks at the demand and provides a guide to the median salaries quoted in IT jobs citing DevOps within the South East region over the 6 months to 28 November 2025. The 'Rank Change' column provides an indication of the change in demand within each location based on the same 6 month period last year.

Location Rank Change
on Same Period
Last Year
Matching
Permanent
IT Job Ads
Median Salary
Past 6 Months
Median Salary
% Change
on Same Period
Last Year
Live
Jobs
Thames Valley -26 148 £63,500 -3.05% 109
Hampshire -22 93 £75,000 +15.38% 46
Berkshire -34 77 £66,250 -11.67% 38
Buckinghamshire +2 54 £60,000 +15.38% 33
Surrey -34 52 £70,000 - 16
Kent +6 41 £37,500 -46.43% 13
West Sussex +3 30 £60,000 - 11
Middlesex +11 26 £37,500 - 4
Oxfordshire -6 17 £67,500 +1.07% 42
East Sussex +11 16 £60,000 -30.43% 18
Isle of Wight -8 9 £45,000 - 2
Sussex +13 4 £45,000 -28.85% 8
DevOps
England

DevOps
Co-Occurring Skills & Capabilities in the South East by Category

The following tables expand on the one above by listing co-occurrences grouped by category. They cover the same employment type, locality and period, with up to 20 co-occurrences shown in each category:

Application Platforms
1 20 (4.78%) IIS
2 8 (1.91%) Apache
3 7 (1.67%) Apache Airflow
4 6 (1.44%) Appian
4 6 (1.44%) Confluence
5 4 (0.96%) nginx
5 4 (0.96%) SharePoint
6 2 (0.48%) Apache Spark
6 2 (0.48%) JBoss
6 2 (0.48%) Red Hat Fuse
7 1 (0.24%) Anypoint
7 1 (0.24%) ArcGIS
7 1 (0.24%) Camunda
7 1 (0.24%) OpenStack
Applications
1 15 (3.59%) Microsoft Office
2 4 (0.96%) Microsoft Excel
2 4 (0.96%) Microsoft PowerPoint
2 4 (0.96%) Microsoft Project
3 3 (0.72%) S-PLUS
4 2 (0.48%) MS Visio
5 1 (0.24%) Photoshop
Business Applications
1 6 (1.44%) Dynamics CRM
2 3 (0.72%) Oracle ERP
2 3 (0.72%) Teamcenter
3 2 (0.48%) SAP S/4HANA
Cloud Services
1 251 (60.05%) Azure
2 164 (39.23%) Azure DevOps
3 115 (27.51%) AWS
4 48 (11.48%) GitHub
5 36 (8.61%) GCP
6 30 (7.18%) Power Platform
7 24 (5.74%) Serverless
8 21 (5.02%) GitHub Actions
9 19 (4.55%) PaaS
9 19 (4.55%) SaaS
10 18 (4.31%) Azure Service Bus
10 18 (4.31%) Entra ID
11 17 (4.07%) Amazon S3
12 16 (3.83%) Azure Cosmos DB
12 16 (3.83%) Vertex AI
13 15 (3.59%) Microsoft 365
14 13 (3.11%) Dynamics 365
15 11 (2.63%) AWS Lambda
16 10 (2.39%) Azure Monitor
17 9 (2.15%) AWS CloudFormation
Communications & Networking
1 28 (6.70%) DNS
2 15 (3.59%) DHCP
3 12 (2.87%) VPN
4 10 (2.39%) LAN
4 10 (2.39%) SAN
4 10 (2.39%) WAN
5 7 (1.67%) SD-WAN
5 7 (1.67%) Unified Communications
5 7 (1.67%) VoIP
5 7 (1.67%) Wi-Fi
6 6 (1.44%) TCP/IP
7 5 (1.20%) Firewall
8 4 (0.96%) HTTP
9 3 (0.72%) Intrusion Detection
10 2 (0.48%) FTP
10 2 (0.48%) SMTP
10 2 (0.48%) SSH
11 1 (0.24%) HTTPS
11 1 (0.24%) S/MIME
11 1 (0.24%) SSL
Database & Business Intelligence
1 49 (11.72%) SQL Server
2 21 (5.02%) Power BI
3 17 (4.07%) Data Mining
4 16 (3.83%) SQL Server Reporting Services
5 15 (3.59%) NoSQL
6 13 (3.11%) MySQL
7 12 (2.87%) Azure SQL Database
7 12 (2.87%) PostgreSQL
8 9 (2.15%) Relational Database
9 8 (1.91%) Data Warehouse
9 8 (1.91%) DynamoDB
9 8 (1.91%) Elasticsearch
10 7 (1.67%) MongoDB
11 5 (1.20%) Airbyte
12 4 (0.96%) SQL Server Integration Services
13 3 (0.72%) Amazon RDS
13 3 (0.72%) BigQuery
13 3 (0.72%) Tableau
14 2 (0.48%) Amazon Redshift
14 2 (0.48%) Looker
Development Applications
1 74 (17.70%) Git
2 33 (7.89%) Jenkins
3 23 (5.50%) Selenium
4 20 (4.78%) Robot Framework
5 19 (4.55%) Snyk
6 14 (3.35%) GitLab
6 14 (3.35%) JIRA
7 11 (2.63%) Octopus Deploy
8 10 (2.39%) Visual Studio
9 8 (1.91%) Storybook
10 6 (1.44%) MSBuild
11 5 (1.20%) Artifactory
11 5 (1.20%) git-flow
11 5 (1.20%) Team Foundation Server
12 4 (0.96%) Cucumber
12 4 (0.96%) Postman
13 3 (0.72%) JUnit
13 3 (0.72%) MLflow
14 2 (0.48%) Appium
14 2 (0.48%) REST Assured
General
1 134 (32.06%) Social Skills
2 76 (18.18%) Finance
3 64 (15.31%) Analytical Skills
4 48 (11.48%) Law
5 31 (7.42%) Retail
6 24 (5.74%) Marketing
7 23 (5.50%) Manufacturing
8 16 (3.83%) Public Sector
9 8 (1.91%) Games
9 8 (1.91%) Telecoms
10 7 (1.67%) Inclusion and Diversity
10 7 (1.67%) Legal
11 6 (1.44%) Banking
12 4 (0.96%) Presentation Skills
13 3 (0.72%) Advertising
13 3 (0.72%) Aerospace
13 3 (0.72%) Automotive
13 3 (0.72%) Military
14 2 (0.48%) Organisational Skills
14 2 (0.48%) Pharmaceutical
Job Titles
1 86 (20.57%) Developer
2 81 (19.38%) Senior
3 80 (19.14%) Lead
4 47 (11.24%) Software Engineer
5 44 (10.53%) DevOps Engineer
6 39 (9.33%) Architect
7 32 (7.66%) Full-Stack Developer
8 29 (6.94%) Analyst
9 26 (6.22%) Senior Developer
10 20 (4.78%) Senior Full-Stack Developer
11 18 (4.31%) Support Engineer
12 15 (3.59%) Platform Engineer
12 15 (3.59%) Software Architect
13 14 (3.35%) Full-Stack Web Developer
13 14 (3.35%) IT Engineer
13 14 (3.35%) Senior Web Developer
13 14 (3.35%) Web Developer
14 13 (3.11%) .NET Developer
14 13 (3.11%) Infrastructure Engineer
14 13 (3.11%) IT Support Engineer
Libraries, Frameworks & Software Standards
1 111 (26.56%) .NET
2 59 (14.11%) React
3 36 (8.61%) .NET Framework
3 36 (8.61%) CSS
4 35 (8.37%) HTML
5 33 (7.89%) REST
6 28 (6.70%) RESTful
7 26 (6.22%) ASP.NET
8 24 (5.74%) Middleware
9 21 (5.02%) Node.js
10 19 (4.55%) Kafka
10 19 (4.55%) WinForms
11 18 (4.31%) .NET Core
12 17 (4.07%) ARM Templates
13 15 (3.59%) Next.js
14 13 (3.11%) AngularJS
15 12 (2.87%) Entity Framework
15 12 (2.87%) WPF
16 11 (2.63%) RabbitMQ
16 11 (2.63%) SOAP
Miscellaneous
1 44 (10.53%) Cloud Native
2 37 (8.85%) Product Ownership
3 16 (3.83%) Algorithms
4 15 (3.59%) Manufacturing Execution System
5 14 (3.35%) Onboarding
6 10 (2.39%) Operational Technology
6 10 (2.39%) Security Posture
7 9 (2.15%) Distributed Systems
8 8 (1.91%) Analytical Mindset
8 8 (1.91%) Mobile App
9 7 (1.67%) Enterprise Software
9 7 (1.67%) Low-Code
10 6 (1.44%) Life Science
10 6 (1.44%) Linux Command Line
11 5 (1.20%) Marketing Technology
11 5 (1.20%) Renewable Energy
12 4 (0.96%) Hybrid Cloud
12 4 (0.96%) IoT
13 3 (0.72%) Greenfield Project
13 3 (0.72%) Legacy Systems
Operating Systems
1 65 (15.55%) Windows
2 37 (8.85%) Linux
3 12 (2.87%) Windows Server
4 10 (2.39%) Windows Server 2012
4 10 (2.39%) Windows Server 2019
5 9 (2.15%) VMS
6 6 (1.44%) Android
6 6 (1.44%) Apple iOS
7 4 (0.96%) Red Hat Enterprise Linux
8 3 (0.72%) CentOS
9 2 (0.48%) Amazon Linux
9 2 (0.48%) Ubuntu
9 2 (0.48%) Unix
10 1 (0.24%) Windows 10
Processes & Methodologies
1 225 (53.83%) Agile
2 183 (43.78%) CI/CD
3 122 (29.19%) Problem-Solving
4 100 (23.92%) Mentoring
5 76 (18.18%) Infrastructure as Code
5 76 (18.18%) Software Engineering
6 75 (17.94%) Continuous Improvement
7 65 (15.55%) Microservices
8 62 (14.83%) Test Automation
9 60 (14.35%) Computer Science
10 56 (13.40%) AI
11 52 (12.44%) Scrum
12 49 (11.72%) Roadmaps
13 46 (11.00%) Machine Learning
14 45 (10.77%) Full-Stack Development
15 41 (9.81%) Coaching
16 39 (9.33%) Design Patterns
16 39 (9.33%) SDLC
17 37 (8.85%) Containerisation
18 36 (8.61%) Waterfall
Programming Languages
1 90 (21.53%) C#
2 87 (20.81%) SQL
3 60 (14.35%) Python
4 48 (11.48%) JavaScript
5 40 (9.57%) PowerShell
6 32 (7.66%) TypeScript
7 22 (5.26%) Java
8 19 (4.55%) Bash
9 14 (3.35%) T-SQL
10 12 (2.87%) Bicep
11 7 (1.67%) Go
12 6 (1.44%) C++
13 5 (1.20%) Apex Code
13 5 (1.20%) PHP
14 4 (0.96%) Perl
15 3 (0.72%) Kusto Query Language
16 2 (0.48%) ABAP
16 2 (0.48%) C
16 2 (0.48%) Data Analysis Expressions
16 2 (0.48%) Groovy
Qualifications
1 90 (21.53%) Degree
2 54 (12.92%) Security Cleared
3 46 (11.00%) Computer Science Degree
4 29 (6.94%) SC Cleared
5 28 (6.70%) DV Cleared
6 24 (5.74%) Azure Certification
7 23 (5.50%) Master's Degree
8 17 (4.07%) BPSS Clearance
9 15 (3.59%) ISTQB
10 14 (3.35%) Chartered Engineer
11 12 (2.87%) ISEB
12 11 (2.63%) AWS Certification
12 11 (2.63%) PMI Certification
12 11 (2.63%) PMP
13 7 (1.67%) AWS Certified Solutions Architect
13 7 (1.67%) CCNP
13 7 (1.67%) Cisco Certification
14 6 (1.44%) Microsoft Certification
15 3 (0.72%) A+ Certification
15 3 (0.72%) CISSP
Quality Assurance & Compliance
1 59 (14.11%) QA
2 16 (3.83%) NIST
3 14 (3.35%) ISO/IEC 12207
4 12 (2.87%) GDPR
4 12 (2.87%) PMO
5 9 (2.15%) Software Quality Assurance
6 8 (1.91%) Accessibility
6 8 (1.91%) NCSC
7 7 (1.67%) ISO/IEC 27001
8 5 (1.20%) SLA
9 2 (0.48%) HIPAA
9 2 (0.48%) PCI DSS
9 2 (0.48%) Sarbanes-Oxley
10 1 (0.24%) Data Quality
10 1 (0.24%) NIST 800
System Software
1 75 (17.94%) Docker
2 31 (7.42%) Active Directory
3 10 (2.39%) VMware ESXi
4 8 (1.91%) Virtual Machines
5 3 (0.72%) VMware Infrastructure
6 2 (0.48%) DFS Replication
7 1 (0.24%) Apache ZooKeeper
7 1 (0.24%) Hyper-V
7 1 (0.24%) vCloud
7 1 (0.24%) Virtual Desktop
7 1 (0.24%) VMware NSX
7 1 (0.24%) vSphere
Systems Management
1 83 (19.86%) Kubernetes
2 73 (17.46%) Terraform
3 35 (8.37%) Ansible
4 18 (4.31%) Microsoft Intune
5 17 (4.07%) Grafana
6 16 (3.83%) Prometheus
7 15 (3.59%) SCCM
8 11 (2.63%) vCenter Server
9 5 (1.20%) MaaS360
10 3 (0.72%) Kubeflow
11 2 (0.48%) Nessus
11 2 (0.48%) Sysdig
12 1 (0.24%) Argo
12 1 (0.24%) Docker Swarm
12 1 (0.24%) Kibana
12 1 (0.24%) Nagios
12 1 (0.24%) Proxmox
12 1 (0.24%) Puppet
12 1 (0.24%) Rundeck
Vendors
1 134 (32.06%) Microsoft
2 30 (7.18%) Google
3 20 (4.78%) VMware
4 18 (4.31%) Black Duck
5 17 (4.07%) Coverity
5 17 (4.07%) OpenAI
6 12 (2.87%) Sage
6 12 (2.87%) Xamarin
7 11 (2.63%) Veeam
8 10 (2.39%) 3PAR
8 10 (2.39%) NetApp
8 10 (2.39%) Oracle
8 10 (2.39%) Salesforce
8 10 (2.39%) SolarWinds
9 9 (2.15%) Rackspace
10 8 (1.91%) Cisco
11 7 (1.67%) Databricks
11 7 (1.67%) Zoho
12 6 (1.44%) Blue Prism
12 6 (1.44%) UiPath