Validation Jobs in the South East

Validation
England > South East

The table below provides summary statistics for permanent job vacancies advertised in the South East requiring Validation skills. It includes a benchmarking guide to the annual salaries offered in vacancies that cited Validation over the 6 months leading up to 16 July 2025, comparing them to the same period in the previous two years.

6 months to
16 Jul 2025
Same period 2024 Same period 2023
Rank 42 129 149
Rank change year-on-year +87 +20 +55
Permanent jobs citing Validation 562 355 264
As % of all permanent jobs advertised in the South East 5.52% 2.06% 2.18%
As % of the Processes & Methodologies category 6.13% 2.51% 2.30%
Number of salaries quoted 161 166 132
10th Percentile £38,750 £35,000 £29,750
25th Percentile £46,250 £40,000 £42,438
Median annual salary (50th Percentile) £60,000 £52,500 £57,500
Median % change year-on-year +14.29% -8.70% +5.22%
75th Percentile £67,500 £67,500 £67,500
90th Percentile £75,900 £76,875 £76,250
England median annual salary £52,600 £55,000 £63,500
% change year-on-year -4.36% -13.39% +15.45%

All Process and Methodology Skills
South East

Validation falls under the Processes and Methodologies category. For comparison with the information above, the following table provides summary statistics for all permanent job vacancies requiring process or methodology skills in the South East.

Permanent vacancies with a requirement for process or methodology skills 9,162 14,128 11,486
As % of all permanent jobs advertised in the South East 89.97% 81.81% 95.04%
Number of salaries quoted 4,815 9,674 7,278
10th Percentile £28,100 £28,250 £30,500
25th Percentile £37,500 £37,500 £41,250
Median annual salary (50th Percentile) £55,000 £50,000 £55,000
Median % change year-on-year +10.00% -9.09% -
75th Percentile £70,000 £65,000 £72,500
90th Percentile £80,000 £80,000 £85,000
England median annual salary £55,000 £55,000 £62,500
% change year-on-year - -12.00% +4.17%

Validation
Job Vacancy Trend in the South East

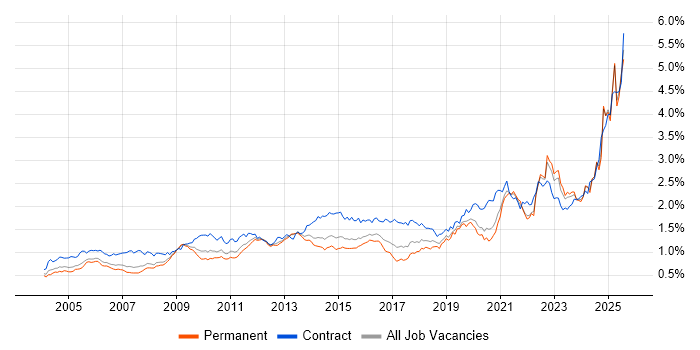
Job postings citing Validation as a proportion of all IT jobs advertised in the South East.

Job vacancy trend for Validation in the South East

Validation
Salary Trend in the South East

3-month moving average salary quoted in jobs citing Validation in the South East.

Salary trend for Validation in the South East

Validation
Salary Histogram in the South East

Salary distribution for jobs citing Validation in the South East over the 6 months to 16 July 2025.

Salary histogram for Validation in the South East

Validation
Job Locations in the South East

The table below looks at the demand and provides a guide to the median salaries quoted in IT jobs citing Validation within the South East region over the 6 months to 16 July 2025. The 'Rank Change' column provides an indication of the change in demand within each location based on the same 6 month period last year.

Location Rank Change
on Same Period
Last Year
Matching
Permanent
IT Job Ads
Median Salary
Past 6 Months
Median Salary
% Change
on Same Period
Last Year
Live
Jobs
Thames Valley +56 303 £63,750 +21.43% 89
Buckinghamshire +79 185 £60,000 +50.00% 30
Isle of Wight - 133 £60,000 - 5
Oxfordshire +46 60 £55,000 +0.92% 32
Hampshire +110 58 £53,750 -15.69% 62
Berkshire -22 58 £69,840 +33.03% 31
Surrey +33 21 £60,000 +31.87% 15
West Sussex +24 19 £51,000 +10.87% 18
Kent -10 19 £39,000 -29.09% 7
East Sussex - 5 - - 6
Sussex +12 2 £75,000 +20.00% 16
Middlesex - 2 - - 4
Validation
England

Validation
Co-occurring Skills and Capabilities in the South East by Category

The follow tables expand on the table above by listing co-occurrences grouped by category. The same employment type, locality and period is covered with up to 20 co-occurrences shown in each of the following categories:

Application Platforms
1 3 (0.53%) SugarCRM
2 2 (0.36%) TPMS
Applications
1 106 (18.86%) Simulink
2 101 (17.97%) Mathcad
3 10 (1.78%) Microsoft Excel
4 3 (0.53%) Microsoft Office
4 3 (0.53%) Spreadsheet
5 1 (0.18%) AutoCAD
5 1 (0.18%) EPLAN
5 1 (0.18%) Microsoft PowerPoint
5 1 (0.18%) Revit
5 1 (0.18%) Siemens NX
Business Applications
1 22 (3.91%) Oracle EBS
2 2 (0.36%) SAP S/4HANA
3 1 (0.18%) Dynamics GP
3 1 (0.18%) Dynamics NAV
3 1 (0.18%) NetSuite
3 1 (0.18%) Payment Gateway
3 1 (0.18%) TrackWise
Cloud Services
1 33 (5.87%) Azure
2 30 (5.34%) AWS
3 24 (4.27%) GCP
3 24 (4.27%) Snowflake
4 15 (2.67%) Power Platform
5 6 (1.07%) Microsoft Purview
6 5 (0.89%) Dynamics 365
7 3 (0.53%) SaaS
8 2 (0.36%) Microsoft 365
9 1 (0.18%) Amazon EMR
9 1 (0.18%) Amazon Kinesis
9 1 (0.18%) Amazon S3
9 1 (0.18%) AWS Lambda
9 1 (0.18%) Cloud Computing
9 1 (0.18%) Salesforce Service Cloud
9 1 (0.18%) Serverless
Communications & Networking
1 221 (39.32%) Wireless
2 220 (39.15%) Wi-Fi
3 217 (38.61%) 5G
3 217 (38.61%) Bluetooth
3 217 (38.61%) GSM
3 217 (38.61%) LTE
3 217 (38.61%) UMTS
4 9 (1.60%) Broadband
5 3 (0.53%) Ethernet
5 3 (0.53%) Software-Defined Radio
6 2 (0.36%) RS-485
7 1 (0.18%) DVB
7 1 (0.18%) Modbus
Database & Business Intelligence
1 27 (4.80%) Data Warehouse
2 26 (4.63%) Metadata
3 25 (4.45%) Data Lake
4 22 (3.91%) Oracle ODI
5 11 (1.96%) Power BI
6 6 (1.07%) MySQL
6 6 (1.07%) SQL Server
7 2 (0.36%) Metadata Repository
7 2 (0.36%) Pentaho
7 2 (0.36%) Tableau
7 2 (0.36%) Triplestore
8 1 (0.18%) Amazon Redshift
8 1 (0.18%) Data Mining
8 1 (0.18%) MongoDB
8 1 (0.18%) NoSQL
Development Applications
1 26 (4.63%) Git
2 9 (1.60%) Rational DOORS
3 7 (1.25%) JIRA
4 5 (0.89%) Subversion
5 4 (0.71%) Jenkins
6 3 (0.53%) PHPUnit
7 2 (0.36%) GitLab
7 2 (0.36%) SonarQube
8 1 (0.18%) CMake
8 1 (0.18%) LabVIEW
8 1 (0.18%) SoapUI
General
1 237 (42.17%) Electronics
2 44 (7.83%) Law
3 40 (7.12%) Social Skills
4 26 (4.63%) Finance
5 24 (4.27%) Aerospace
6 23 (4.09%) Analytical Skills
7 17 (3.02%) Manufacturing
8 15 (2.67%) Games
8 15 (2.67%) Marketing
9 9 (1.60%) Aviation
10 8 (1.42%) Avionics
11 6 (1.07%) Health Technology
11 6 (1.07%) Inclusion and Diversity
12 5 (0.89%) Telecoms
13 4 (0.71%) Pharmaceutical
13 4 (0.71%) Presentation Skills
13 4 (0.71%) Public Sector
14 3 (0.53%) Legal
14 3 (0.53%) Military
15 2 (0.36%) Retail
Job Titles
1 256 (45.55%) Test Engineer
2 221 (39.32%) Electronics Engineer
3 217 (38.61%) Electronics Test Engineer
4 158 (28.11%) Senior
5 82 (14.59%) Mathematical Modeller
6 53 (9.43%) Lead
7 38 (6.76%) Senior Software Test Engineer
7 38 (6.76%) Senior Test Engineer
7 38 (6.76%) Software Test Engineer
8 15 (2.67%) Consultant
8 15 (2.67%) Data Consultant
8 15 (2.67%) Data Migration Consultant
8 15 (2.67%) Migration Consultant
8 15 (2.67%) Oracle Consultant
8 15 (2.67%) Oracle Data Migration Consultant
8 15 (2.67%) Oracle Technical Consultant
8 15 (2.67%) Technical Consultant
9 14 (2.49%) Developer
10 13 (2.31%) Administrator
11 12 (2.14%) Engineering Manager
Libraries, Frameworks & Software Standards
1 23 (4.09%) Oracle Fusion
2 13 (2.31%) Qt
3 3 (0.53%) CakePHP
3 3 (0.53%) CSS
3 3 (0.53%) FHIR
3 3 (0.53%) HTML
3 3 (0.53%) Laravel
4 2 (0.36%) Apache Jena
4 2 (0.36%) LAMP
4 2 (0.36%) XML
5 1 (0.18%) Bazel
5 1 (0.18%) Kafka
5 1 (0.18%) Node.js
5 1 (0.18%) NumPy
5 1 (0.18%) Pandas
5 1 (0.18%) PyTorch
5 1 (0.18%) React
5 1 (0.18%) Restlet
5 1 (0.18%) scikit-learn
5 1 (0.18%) TensorFlow
Miscellaneous
1 225 (40.04%) Driving Licence
2 31 (5.52%) Management Information System
3 24 (4.27%) Data Structures
4 22 (3.91%) Legacy Systems
5 20 (3.56%) Algorithms
6 15 (2.67%) Embedded Systems
7 14 (2.49%) Life Science
8 11 (1.96%) Operational Technology
9 10 (1.78%) Product Ownership
10 9 (1.60%) Video\Live Streaming
11 8 (1.42%) FPGA
11 8 (1.42%) Onboarding
12 7 (1.25%) Hybrid Cloud
13 4 (0.71%) CMDB
13 4 (0.71%) CPLD
14 3 (0.53%) Biopharmaceutical
14 3 (0.53%) Credit Risk
14 3 (0.53%) e-Learning
14 3 (0.53%) SCADA
15 2 (0.36%) Analytical Mindset
Operating Systems
1 5 (0.89%) Linux
2 3 (0.53%) Windows
3 1 (0.18%) Android
3 1 (0.18%) Ubuntu
3 1 (0.18%) Unix
Processes & Methodologies
1 405 (72.06%) Verification and Validation
2 225 (40.04%) Mentoring
3 221 (39.32%) Customer Requirements
4 217 (38.61%) Coaching
4 217 (38.61%) Test Strategy
5 138 (24.56%) Problem-Solving
6 114 (20.28%) Mathematics
6 114 (20.28%) Systems Engineering
7 104 (18.51%) Mathematical Modelling
8 102 (18.15%) Performance Analysis
9 64 (11.39%) Agile
10 57 (10.14%) Test Automation
11 55 (9.79%) Software Testing
12 50 (8.90%) ETL
13 47 (8.36%) Computer Science
14 40 (7.12%) Configuration Management
14 40 (7.12%) Data Management
15 39 (6.94%) Data Validation
16 37 (6.58%) UML
16 37 (6.58%) Waterfall
Programming Languages
1 159 (28.29%) Python
2 112 (19.93%) MATLAB
3 50 (8.90%) SQL
4 24 (4.27%) C
5 23 (4.09%) C++
6 22 (3.91%) PL/SQL
7 14 (2.49%) Ada
8 9 (1.60%) C#
9 5 (0.89%) JavaScript
10 4 (0.71%) PHP
11 3 (0.53%) Java
11 3 (0.53%) T-SQL
12 2 (0.36%) Shell Script
12 2 (0.36%) SPARQL
13 1 (0.18%) Embedded C
13 1 (0.18%) Objective-C
13 1 (0.18%) Rust
13 1 (0.18%) Scala
13 1 (0.18%) TypeScript
Qualifications
1 338 (60.14%) Degree
2 217 (38.61%) HND
3 132 (23.49%) BPSS Clearance
4 34 (6.05%) Computer Science Degree
5 25 (4.45%) Numerate Degree
6 12 (2.14%) Master's Degree
6 12 (2.14%) Security Cleared
7 11 (1.96%) SC Cleared
8 6 (1.07%) DV Cleared
9 4 (0.71%) HNC
9 4 (0.71%) ITIL Certification
10 3 (0.53%) CCNA
10 3 (0.53%) Cisco Certification
11 2 (0.36%) CEH
11 2 (0.36%) CISM
11 2 (0.36%) CISSP
11 2 (0.36%) DBS Check
12 1 (0.18%) AWS Certification
12 1 (0.18%) Chartered Engineer
12 1 (0.18%) ISEB
Quality Assurance & Compliance
1 100 (17.79%) ISO/IEC 15288
2 39 (6.94%) QA
3 36 (6.41%) Data Quality
4 33 (5.87%) Accessibility
5 16 (2.85%) GxP
6 12 (2.14%) ISO/IEC 12207
7 5 (0.89%) 21 CFR Part 11
8 3 (0.53%) GAMP
8 3 (0.53%) Good Clinical Practice
8 3 (0.53%) ISO/IEC 27001
8 3 (0.53%) NIST
9 2 (0.36%) Dublin Core
9 2 (0.36%) GDPR
10 1 (0.18%) AUTOSAR
10 1 (0.18%) GLP
10 1 (0.18%) GMP
10 1 (0.18%) ISO 9001
10 1 (0.18%) NIST 800
10 1 (0.18%) Sarbanes-Oxley
10 1 (0.18%) SOC 2
System Software
1 11 (1.96%) VMware Infrastructure
2 10 (1.78%) Firmware
3 3 (0.53%) Docker
4 2 (0.36%) vCloud
5 1 (0.18%) Embedded Firmware
Systems Management
1 3 (0.53%) Kubernetes
2 2 (0.36%) Ansible
2 2 (0.36%) Docker Swarm
2 2 (0.36%) Rundeck
Vendors
1 101 (17.97%) MathWorks
2 26 (4.63%) Oracle
3 14 (2.49%) Salesforce
4 13 (2.31%) ServiceNow
4 13 (2.31%) VMware
5 7 (1.25%) IBM
5 7 (1.25%) Microsoft
5 7 (1.25%) Red Hat
5 7 (1.25%) SAP
6 5 (0.89%) EMC
7 4 (0.71%) Agilent
8 3 (0.53%) Cisco
8 3 (0.53%) Ekahau
8 3 (0.53%) Meraki
8 3 (0.53%) Siemens
8 3 (0.53%) Xilinx
9 2 (0.36%) Freescale
9 2 (0.36%) Informatica
9 2 (0.36%) Talend
10 1 (0.18%) Allen-Bradley