Microsoft Office Jobs in the South East

Microsoft Office
England > South East

The table below provides summary statistics for permanent job vacancies advertised in the South East requiring Microsoft Office skills. It includes a benchmarking guide to the annual salaries offered in vacancies that cited Microsoft Office over the 6 months leading up to 26 July 2024, comparing them to the same period in the previous two years.

6 months to
26 Jul 2024
Same period 2023 Same period 2022
Rank 38 64 65
Rank change year-on-year +26 +1 +35
Permanent jobs citing Microsoft Office 785 524 1,047
As % of all permanent jobs advertised in the South East 5.20% 4.52% 4.75%
As % of the Applications category 40.67% 49.67% 43.86%
Number of salaries quoted 398 353 647
10th Percentile £23,000 £25,000 £24,500
25th Percentile £25,750 £26,750 £27,000
Median annual salary (50th Percentile) £32,500 £35,000 £35,000
Median % change year-on-year -7.14% - -
75th Percentile £48,750 £50,000 £47,500
90th Percentile £62,500 £60,000 £64,250
England median annual salary £35,000 £40,000 £37,500
% change year-on-year -12.50% +6.67% -6.25%

All Software Application Skills
South East

Microsoft Office falls under the Software Applications category. For comparison with the information above, the following table provides summary statistics for all permanent job vacancies requiring software application skills in the South East.

Permanent vacancies with a requirement for software application skills 1,930 1,055 2,387
As % of all permanent jobs advertised in the South East 12.79% 9.10% 10.82%
Number of salaries quoted 948 670 1,158
10th Percentile £25,000 £25,000 £26,000
25th Percentile £29,000 £29,750 £30,000
Median annual salary (50th Percentile) £42,500 £41,500 £42,500
Median % change year-on-year +2.41% -2.35% +2.41%
75th Percentile £55,000 £57,500 £57,500
90th Percentile £71,250 £70,000 £65,000
England median annual salary £40,450 £45,000 £45,000
% change year-on-year -10.11% - -

Microsoft Office
Job Vacancy Trend in the South East

Job postings citing Microsoft Office as a proportion of all IT jobs advertised in the South East.
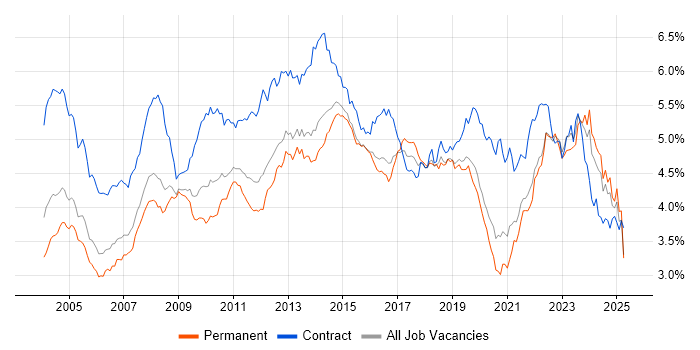
Job vacancy trend for Microsoft Office in the South East

Microsoft Office
Salary Trend in the South East

3-month moving average salary quoted in jobs citing Microsoft Office in the South East.

Salary trend for Microsoft Office in the South East

Microsoft Office
Salary Histogram in the South East

Salary distribution for jobs citing Microsoft Office in the South East over the 6 months to 26 July 2024.

Salary histogram for Microsoft Office in the South East

Microsoft Office
Job Locations in the South East

The table below looks at the demand and provides a guide to the median salaries quoted in IT jobs citing Microsoft Office within the South East region over the 6 months to 26 July 2024. The 'Rank Change' column provides an indication of the change in demand within each location based on the same 6 month period last year.

Location Rank Change
on Same Period
Last Year
Matching
Permanent
IT Job Ads
Median Salary
Past 6 Months
Median Salary
% Change
on Same Period
Last Year
Live
Jobs
Thames Valley +36 346 £34,000 +4.62% 81
Surrey +14 183 £42,500 +17.24% 29
Oxfordshire +50 146 £42,500 +34.92% 20
Berkshire +6 111 £33,000 -16.46% 38
Hampshire +2 95 £29,500 -20.00% 57
Buckinghamshire +29 89 £32,500 - 23
Kent -12 67 £28,500 - 24
East Sussex +25 45 £90,000 +100.00% 9
West Sussex +22 33 £27,500 -22.54% 30
Home Counties +11 7 - -
Middlesex - 5 £32,725 - 1
Sussex - 2 £32,750 - 3
Microsoft Office
England

Microsoft Office
Co-occurring Skills and Capabilities in the South East by Category

The follow tables expand on the table above by listing co-occurrences grouped by category. The same employment type, locality and period is covered with up to 20 co-occurrences shown in each of the following categories:

Application Platforms
1 82 (10.45%) SharePoint
2 44 (5.61%) Microsoft Exchange
3 8 (1.02%) CMS
4 5 (0.64%) Exchange Server 2013
5 4 (0.51%) SAS
6 3 (0.38%) Oracle Service Bus
6 3 (0.38%) WebLogic
7 2 (0.25%) WordPress
8 1 (0.13%) Exchange Server 2010
8 1 (0.13%) IIS
Applications
1 363 (46.24%) Microsoft Excel
2 52 (6.62%) Microsoft PowerPoint
3 32 (4.08%) MS Visio
4 18 (2.29%) Microsoft Project
5 8 (1.02%) Spreadsheet
6 7 (0.89%) AutoCAD
6 7 (0.89%) Photoshop
7 6 (0.76%) OrCAD
8 4 (0.51%) InDesign
9 2 (0.25%) Adobe Creative Suite
9 2 (0.25%) Adobe Illustrator
10 1 (0.13%) Revit
10 1 (0.13%) SOLIDWORKS
Business Applications
1 6 (0.76%) Dynamics CRM
1 6 (0.76%) SAP S/4HANA
2 5 (0.64%) Remedy ITSM
2 5 (0.64%) ResourceLink
3 2 (0.25%) NetSuite
4 1 (0.13%) assyst
4 1 (0.13%) iTrent
4 1 (0.13%) Maximo
4 1 (0.13%) Primavera
4 1 (0.13%) SAP Business One
Cloud Services
1 177 (22.55%) Microsoft 365
2 76 (9.68%) Azure
3 48 (6.11%) Power Platform
4 34 (4.33%) PowerApps
5 33 (4.20%) OneDrive
6 27 (3.44%) Entra ID
7 26 (3.31%) Dynamics 365
8 14 (1.78%) GitHub
9 12 (1.53%) Power Automate
10 11 (1.40%) ShareGate
11 10 (1.27%) Azure DevOps
11 10 (1.27%) Google Workspace
12 7 (0.89%) SuccessFactors
13 5 (0.64%) IaaS
13 5 (0.64%) PaaS
14 4 (0.51%) AWS
15 3 (0.38%) Dropbox
15 3 (0.38%) Mimecast
15 3 (0.38%) SaaS
16 2 (0.25%) Figma
Communications & Networking
1 66 (8.41%) Firewall
2 40 (5.10%) DNS
3 37 (4.71%) DHCP
4 33 (4.20%) Wi-Fi
5 30 (3.82%) Wireless
6 25 (3.18%) TCP/IP
7 24 (3.06%) VPN
8 21 (2.68%) LAN
9 12 (1.53%) VLAN
10 10 (1.27%) FTP
11 8 (1.02%) VoIP
11 8 (1.02%) WAN
12 7 (0.89%) Internet
12 7 (0.89%) Intranet
12 7 (0.89%) Remote Desktop
13 6 (0.76%) Broadband
14 5 (0.64%) 4G
14 5 (0.64%) Modbus
15 4 (0.51%) WebEx
15 4 (0.51%) xDSL
Database & Business Intelligence
1 41 (5.22%) Power BI
2 25 (3.18%) SQL Server
3 7 (0.89%) Amazon RDS
4 4 (0.51%) Big Data
5 3 (0.38%) Oracle Database
5 3 (0.38%) Oracle Database 10g
5 3 (0.38%) Oracle Database 11g
5 3 (0.38%) VLDB
6 2 (0.25%) Crystal Reports
6 2 (0.25%) Tableau
7 1 (0.13%) Data Warehouse
7 1 (0.13%) GIS
7 1 (0.13%) Relational Database
7 1 (0.13%) SQL Server Reporting Services
Development Applications
1 14 (1.78%) JIRA
1 14 (1.78%) MSI
1 14 (1.78%) Visual Studio
2 13 (1.66%) AdminStudio
2 13 (1.66%) InstallShield
3 10 (1.27%) Visual Studio Code
4 5 (0.64%) eggPlant
5 4 (0.51%) Eclipse
5 4 (0.51%) GitLab
5 4 (0.51%) Subversion
6 2 (0.25%) Balsamiq
7 1 (0.13%) Git
7 1 (0.13%) Hudson
7 1 (0.13%) Jenkins
7 1 (0.13%) SQL Server Management Studio (SSMS)
General
1 359 (45.73%) Social Skills
2 224 (28.54%) Finance
3 175 (22.29%) Analytical Skills
4 169 (21.53%) Marketing
5 159 (20.25%) Retail
6 129 (16.43%) Organisational Skills
7 52 (6.62%) Telecoms
8 41 (5.22%) Legal
9 31 (3.95%) Inclusion and Diversity
10 27 (3.44%) Presentation Skills
11 25 (3.18%) Documentation Skills
12 24 (3.06%) Law
13 23 (2.93%) Military
14 18 (2.29%) Public Sector
15 16 (2.04%) Manufacturing
15 16 (2.04%) Pharmaceutical
16 12 (1.53%) Advertising
16 12 (1.53%) Electronics
17 10 (1.27%) Influencing Skills
18 7 (0.89%) Aviation
Job Titles
1 119 (15.16%) Development Manager
2 105 (13.38%) Coordinator
3 102 (12.99%) Analyst
4 90 (11.46%) IT Support
5 60 (7.64%) Support Engineer
6 56 (7.13%) IT Engineer
7 53 (6.75%) Support Analyst
8 46 (5.86%) IT Support Engineer
9 43 (5.48%) 1st Line Support
10 30 (3.82%) Architect
11 28 (3.57%) Project Manager
12 27 (3.44%) IT Technician
13 25 (3.18%) 1st Line Support Analyst
14 22 (2.80%) 3rd Line Support
14 22 (2.80%) Graduate
15 20 (2.55%) Power Platform Architect
15 20 (2.55%) Support Technician
15 20 (2.55%) Technical Architect
16 19 (2.42%) IT Support Technician
17 18 (2.29%) 2nd Line Support
Libraries, Frameworks & Software Standards
1 21 (2.68%) .NET
2 13 (1.66%) HTML
3 10 (1.27%) Blazor
3 10 (1.27%) HTML5
4 9 (1.15%) EDI
5 6 (0.76%) JSON
6 5 (0.64%) Flash
6 5 (0.64%) XML
7 4 (0.51%) EDIFACT
8 3 (0.38%) CSS
9 1 (0.13%) .NET Core
9 1 (0.13%) .NET Framework
9 1 (0.13%) AngularJS
9 1 (0.13%) ASP.NET
9 1 (0.13%) Entity Framework
9 1 (0.13%) jQuery
9 1 (0.13%) Middleware
9 1 (0.13%) Yocto
Miscellaneous
1 151 (19.24%) Self-Motivation
2 41 (5.22%) Driving Licence
3 28 (3.57%) Onboarding
4 20 (2.55%) Management Information System
5 13 (1.66%) Shadow IT
6 12 (1.53%) CCTV
7 11 (1.40%) Social Media
8 7 (0.89%) Handset
9 6 (0.76%) Housing Association
9 6 (0.76%) Video Conferencing
9 6 (0.76%) Xbox
10 5 (0.64%) Client/Server
10 5 (0.64%) Data Centre
10 5 (0.64%) IoT
10 5 (0.64%) Low-Code
10 5 (0.64%) NB-IoT
11 4 (0.51%) ARM Cortex
11 4 (0.51%) Learning Management System
11 4 (0.51%) Life Science
11 4 (0.51%) SCADA
Operating Systems
1 208 (26.50%) Windows
2 77 (9.81%) Windows 10
3 65 (8.28%) Windows Server
4 19 (2.42%) Mac OS
5 16 (2.04%) Windows 7
5 16 (2.04%) Windows Server 2016
5 16 (2.04%) Windows Server 2019
6 14 (1.78%) Linux
7 12 (1.53%) Windows Server 2012
8 9 (1.15%) Apple iOS
9 8 (1.02%) Windows Server 2008
10 6 (0.76%) Android
11 3 (0.38%) Solaris
11 3 (0.38%) Unix
11 3 (0.38%) VxWorks
12 2 (0.25%) Ubuntu
12 2 (0.25%) Windows 8
13 1 (0.13%) Embedded Linux
Processes & Methodologies
1 209 (26.62%) Problem-Solving
2 188 (23.95%) Agile
3 155 (19.75%) Logistics
4 151 (19.24%) Customer Service
5 149 (18.98%) Business Development
6 148 (18.85%) Data Management
7 142 (18.09%) Customer Requirements
8 139 (17.71%) CAD
9 135 (17.20%) Commercial Awareness
10 132 (16.82%) Facilities Management
11 130 (16.56%) Financial Modelling
12 76 (9.68%) ITIL
13 69 (8.79%) Project Management
14 66 (8.41%) Continuous Improvement
15 52 (6.62%) Business Intelligence
16 41 (5.22%) Project Delivery
17 39 (4.97%) Change Control
18 38 (4.84%) Service Delivery
19 37 (4.71%) Service Management
20 36 (4.59%) Cybersecurity
Programming Languages
1 46 (5.86%) SQL
2 28 (3.57%) PowerShell
3 24 (3.06%) C#
4 18 (2.29%) JavaScript
4 18 (2.29%) VB
5 10 (1.27%) C++
6 5 (0.64%) Assembly Language
6 5 (0.64%) PHP
6 5 (0.64%) VBA
7 4 (0.51%) ActionScript
7 4 (0.51%) ActionScript 2.0
7 4 (0.51%) Python
7 4 (0.51%) VB.NET
7 4 (0.51%) VBScript
8 3 (0.38%) PL/SQL
9 2 (0.25%) T-SQL
10 1 (0.13%) Bash
10 1 (0.13%) Embedded C
10 1 (0.13%) Embedded C++
10 1 (0.13%) R
Qualifications
1 213 (27.13%) Degree
2 68 (8.66%) Security Cleared
3 41 (5.22%) SC Cleared
4 39 (4.97%) DBS Check
5 28 (3.57%) DV Cleared
6 17 (2.17%) Master's Degree
7 12 (1.53%) A+ Certification
8 11 (1.40%) ITIL Certification
8 11 (1.40%) Microsoft Certification
9 8 (1.02%) CCNA
9 8 (1.02%) Cisco Certification
9 8 (1.02%) CRISC
10 5 (0.64%) Azure Certification
10 5 (0.64%) MCP
10 5 (0.64%) Network+ Certification
11 4 (0.51%) Computer Science Degree
11 4 (0.51%) HNC
11 4 (0.51%) HND
11 4 (0.51%) MAPM
11 4 (0.51%) MCSE
Quality Assurance & Compliance
1 69 (8.79%) SLA
2 28 (3.57%) QA
3 25 (3.18%) GDPR
4 10 (1.27%) Accessibility
4 10 (1.27%) PMO
5 4 (0.51%) IEC 61131
5 4 (0.51%) JTAG
6 3 (0.38%) Data Quality
7 2 (0.25%) Cyber Essentials
7 2 (0.25%) ISO 9001
8 1 (0.13%) Actionable Recommendations
8 1 (0.13%) Automotive SPICE
8 1 (0.13%) COSHH
8 1 (0.13%) IFRS
8 1 (0.13%) ISO 13485
8 1 (0.13%) ISO 14001
8 1 (0.13%) ISO 26262
8 1 (0.13%) NEBOSH
System Software
1 151 (19.24%) Active Directory
2 40 (5.10%) VMware Infrastructure
3 20 (2.55%) Hyper-V
4 14 (1.78%) Microsoft App-V
5 6 (0.76%) Virtual Desktop
6 5 (0.64%) Docker
7 4 (0.51%) Firmware
8 3 (0.38%) KVM
8 3 (0.38%) Oracle RAC
8 3 (0.38%) VirtualBox
9 2 (0.25%) Microsoft Virtual Server
9 2 (0.25%) Virtual Servers
10 1 (0.13%) Embedded Firmware
10 1 (0.13%) vSphere
10 1 (0.13%) XenApp
Systems Management
1 22 (2.80%) SCCM
2 16 (2.04%) WSUS
3 13 (1.66%) Microsoft Intune
4 3 (0.38%) Data Guard
4 3 (0.38%) Oracle RMAN
5 2 (0.25%) Autotask
5 2 (0.25%) Dell DRAC
5 2 (0.25%) Jamf Pro
6 1 (0.13%) Functional Safety
Vendors
1 599 (76.31%) Microsoft
2 44 (5.61%) VMware
3 22 (2.80%) SAP
4 21 (2.68%) Citrix
5 20 (2.55%) Google
6 17 (2.17%) ServiceNow
6 17 (2.17%) Veeam
7 15 (1.91%) Autodesk
8 14 (1.78%) WatchGuard
9 11 (1.40%) Apple
9 11 (1.40%) Nintex
10 10 (1.27%) Cisco
11 8 (1.02%) Dell
11 8 (1.02%) Meraki
11 8 (1.02%) Remedy
12 7 (0.89%) Salesforce
13 6 (0.76%) Adobe
13 6 (0.76%) EMC
13 6 (0.76%) NEC
13 6 (0.76%) Oracle