Security Cleared Jobs in the South East

Security Clearance
England > South East

The table below provides summary statistics for permanent job vacancies advertised in the South East with a requirement for Security Cleared qualifications. It includes a benchmarking guide to the salaries offered over the 6 months leading up to 2 July 2025, comparing them to the same period in the previous two years.

6 months to
2 Jul 2025
Same period 2024 Same period 2023
Rank 20 10 13
Rank change year-on-year -10 +3 +35
Permanent jobs citing Security Cleared 807 2,058 1,531
As % of all permanent jobs advertised in the South East 8.16% 11.21% 11.95%
As % of the Qualifications category 15.46% 34.72% 29.72%
Number of salaries quoted 510 1,370 821
10th Percentile £38,500 £35,000 £31,250
25th Percentile £47,500 £42,500 £36,713
Median annual salary (50th Percentile) £60,000 £55,000 £50,000
Median % change year-on-year +9.09% +10.00% -7.11%
75th Percentile £78,750 £70,000 £67,500
90th Percentile £87,500 £83,750 £82,500
England median annual salary £62,500 £57,500 £60,000
% change year-on-year +8.70% -4.17% +9.09%

All Academic and Professional Certifications
South East

Security Cleared falls under the Academic Qualifications and Professional Certifications category. For comparison with the information above, the following table provides summary statistics for all permanent job vacancies requiring academic qualifications or professional certifications in the South East.

Permanent vacancies requiring academic qualifications or professional certifications 5,221 5,927 5,152
As % of all permanent jobs advertised in the South East 52.79% 32.30% 40.22%
Number of salaries quoted 2,479 3,612 2,389
10th Percentile £34,988 £30,005 £29,200
25th Percentile £42,500 £38,603 £36,953
Median annual salary (50th Percentile) £60,000 £51,000 £51,573
Median % change year-on-year +17.65% -1.11% +2.12%
75th Percentile £70,600 £67,500 £67,500
90th Percentile £78,750 £82,500 £83,750
England median annual salary £55,000 £54,000 £60,000
% change year-on-year +1.85% -10.00% +9.09%

Security Cleared
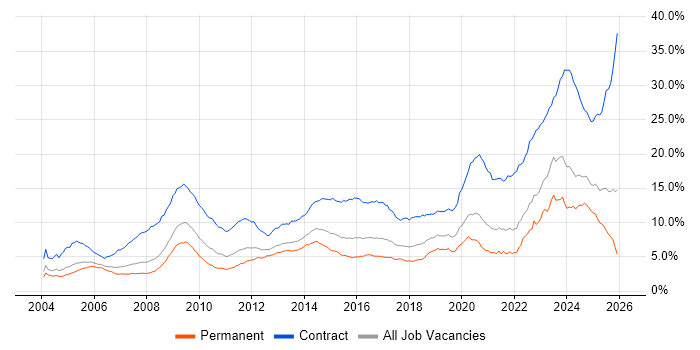
Job Vacancy Trend in the South East

Job postings citing Security Cleared as a proportion of all IT jobs advertised in the South East.

Job vacancy trend for Security Cleared in the South East

Security Cleared
Salary Trend in the South East

3-month moving average salary quoted in jobs citing Security Cleared in the South East.

Salary trend for Security Cleared in the South East

Security Cleared
Salary Histogram in the South East

Salary distribution for jobs citing Security Cleared in the South East over the 6 months to 2 July 2025.

Salary histogram for Security Cleared in the South East

Security Cleared
Job Locations in the South East

The table below looks at the demand and provides a guide to the median salaries quoted in IT jobs citing Security Cleared within the South East region over the 6 months to 2 July 2025. The 'Rank Change' column provides an indication of the change in demand within each location based on the same 6 month period last year.

Location Rank Change
on Same Period
Last Year
Matching
Permanent
IT Job Ads
Median Salary
Past 6 Months
Median Salary
% Change
on Same Period
Last Year
Live
Jobs
Hampshire +2 500 £61,500 +6.96% 507
Thames Valley -42 187 £57,585 +9.58% 558
Berkshire -29 137 £61,500 +17.03% 344
Surrey -25 72 £45,000 -18.18% 206
Oxfordshire +9 25 £51,750 -0.02% 72
Buckinghamshire -29 25 £52,500 -4.55% 149
Kent +26 24 £57,500 +36.90% 62
West Sussex +22 12 £37,500 -43.40% 104
East Sussex +25 6 £50,000 -45.95% 52
Sussex +15 2 £51,250 -14.58% 20
Middlesex -24 2 - - 10
Home Counties - 1 £60,000 -
Security Cleared
England

Security Cleared
Co-occurring Skills and Capabilities in the South East by Category

The follow tables expand on the table above by listing co-occurrences grouped by category. The same employment type, locality and period is covered with up to 20 co-occurrences shown in each of the following categories:

Application Platforms
1 35 (4.34%) Microsoft Exchange
2 14 (1.73%) Apache
3 12 (1.49%) JBoss
3 12 (1.49%) Red Hat Fuse
4 8 (0.99%) SharePoint
5 4 (0.50%) Confluence
5 4 (0.50%) Exchange Server 2013
5 4 (0.50%) Office Communications Server
5 4 (0.50%) Skype for Business
6 3 (0.37%) Apache Airflow
6 3 (0.37%) Appian
6 3 (0.37%) Exchange Server 2007
6 3 (0.37%) Exchange Server 2010
6 3 (0.37%) IIS
6 3 (0.37%) SharePoint Server
7 2 (0.25%) Apache Spark
8 1 (0.12%) OpenStack
8 1 (0.12%) SharePoint 2010
Applications
1 23 (2.85%) Microsoft Office
2 14 (1.73%) Microsoft Excel
3 9 (1.12%) Microsoft PowerPoint
4 5 (0.62%) Simulink
5 4 (0.50%) Mozilla Thunderbird
6 2 (0.25%) GNU Octave
6 2 (0.25%) OrCAD
7 1 (0.12%) Trello
Business Applications
1 21 (2.60%) Sparx Enterprise Architect
2 7 (0.87%) Q-Pulse
3 2 (0.25%) SAP HR
3 2 (0.25%) SAP Payroll
4 1 (0.12%) C-CURE
4 1 (0.12%) Maximo
4 1 (0.12%) Sage 200
4 1 (0.12%) SAP MM
4 1 (0.12%) SAP S/4HANA
Cloud Services
1 113 (14.00%) AWS
2 91 (11.28%) Azure
3 41 (5.08%) Amazon EKS
4 31 (3.84%) Serverless
5 30 (3.72%) IaaS
6 26 (3.22%) Amazon ECS
7 24 (2.97%) AWS CloudFormation
8 22 (2.73%) SaaS
9 21 (2.60%) GCP
10 18 (2.23%) Amazon EC2
11 15 (1.86%) Amazon S3
12 13 (1.61%) PaaS
13 12 (1.49%) Power Platform
14 11 (1.36%) Microsoft 365
14 11 (1.36%) OCI
15 9 (1.12%) AWS Lambda
15 9 (1.12%) Dynamics 365
15 9 (1.12%) Virtual Private Cloud
16 8 (0.99%) Azure DevOps
17 7 (0.87%) Entra ID
Communications & Networking
1 85 (10.53%) Firewall
2 49 (6.07%) BGP
3 48 (5.95%) Software-Defined Radio
4 41 (5.08%) OSPF
5 39 (4.83%) WAN
6 38 (4.71%) DNS
6 38 (4.71%) Network Security
7 35 (4.34%) EIGRP
8 34 (4.21%) VPN
9 28 (3.47%) SAN
10 26 (3.22%) TCP/IP
10 26 (3.22%) VSAN
11 25 (3.10%) NAS
11 25 (3.10%) Wireless
12 23 (2.85%) Cisco ISE
13 22 (2.73%) Junos
14 21 (2.60%) VoIP
15 20 (2.48%) DHCP
16 18 (2.23%) ATM
16 18 (2.23%) LAN
Database & Business Intelligence
1 34 (4.21%) PostgreSQL
2 22 (2.73%) Relational Database
3 20 (2.48%) Elasticsearch
4 17 (2.11%) SQL Server
5 16 (1.98%) MongoDB
6 13 (1.61%) Amazon RDS
7 10 (1.24%) RDBMS
8 6 (0.74%) MySQL
8 6 (0.74%) Power BI
9 5 (0.62%) Metadata
10 4 (0.50%) Amazon Aurora
10 4 (0.50%) GIS
11 3 (0.37%) DynamoDB
11 3 (0.37%) Metadata Repository
12 2 (0.25%) Geospatial Data
12 2 (0.25%) NoSQL
12 2 (0.25%) Pentaho
12 2 (0.25%) Triplestore
13 1 (0.12%) Airbyte
13 1 (0.12%) Data Lake
Development Applications
1 43 (5.33%) Jenkins
2 29 (3.59%) JUnit
3 28 (3.47%) Git
4 22 (2.73%) MSI
5 17 (2.11%) Mockito
6 15 (1.86%) JIRA
7 10 (1.24%) JMeter
8 7 (0.87%) Bitbucket Server
9 6 (0.74%) NDoc
10 5 (0.62%) SonarQube
10 5 (0.62%) Subversion
11 4 (0.50%) GitLab
11 4 (0.50%) Maven
11 4 (0.50%) SoapUI
12 3 (0.37%) DbUnit
12 3 (0.37%) jMock
12 3 (0.37%) Robot Framework
12 3 (0.37%) Selenium
12 3 (0.37%) Snyk
13 2 (0.25%) CMake
General
1 110 (13.63%) Social Skills
2 80 (9.91%) Finance
3 71 (8.80%) Inclusion and Diversity
4 61 (7.56%) Military
5 51 (6.32%) Analytical Skills
6 49 (6.07%) Public Sector
7 38 (4.71%) Aerospace
8 27 (3.35%) Electronics
9 22 (2.73%) Advertising
9 22 (2.73%) Telecoms
10 17 (2.11%) Aviation
11 11 (1.36%) Manufacturing
12 8 (0.99%) Organisational Skills
12 8 (0.99%) Retail
13 7 (0.87%) Presentation Skills
14 6 (0.74%) Documentation Skills
15 5 (0.62%) Influencing Skills
16 4 (0.50%) Legal
16 4 (0.50%) Marketing
17 2 (0.25%) Law
Job Titles
1 126 (15.61%) Architect
2 79 (9.79%) Developer
3 77 (9.54%) Network Engineer
4 71 (8.80%) Systems Engineer
5 68 (8.43%) Support Engineer
6 59 (7.31%) Lead
7 57 (7.06%) Senior
8 42 (5.20%) Network Architect
9 39 (4.83%) Software Engineer
10 38 (4.71%) Infrastructure Engineer
11 29 (3.59%) Field Engineer
11 29 (3.59%) Java Developer
12 28 (3.47%) Analyst
13 27 (3.35%) Designer
13 27 (3.35%) Infrastructure Support
14 26 (3.22%) Infrastructure Support Engineer
15 24 (2.97%) Embedded Engineer
15 24 (2.97%) Radio Engineer
15 24 (2.97%) Technical Engineer
15 24 (2.97%) Technical Support Engineer
Libraries, Frameworks & Software Standards
1 32 (3.97%) Spring Boot
1 32 (3.97%) Web Services
2 30 (3.72%) REST
2 30 (3.72%) Spring
3 23 (2.85%) SOAP
4 22 (2.73%) .NET
4 22 (2.73%) Apache Camel
5 20 (2.48%) Kafka
5 20 (2.48%) Node.js
6 19 (2.35%) RESTful
7 18 (2.23%) Pandas
7 18 (2.23%) XML
8 16 (1.98%) ActiveMQ
8 16 (1.98%) Hibernate
8 16 (1.98%) SAPUI5
9 15 (1.86%) HTML
10 13 (1.61%) React
11 12 (1.49%) J2EE
12 10 (1.24%) AngularJS
12 10 (1.24%) jQuery
Miscellaneous
1 51 (6.32%) e-Learning
2 39 (4.83%) PKI
3 36 (4.46%) FPGA
4 33 (4.09%) Management Information System
5 31 (3.84%) Driving Licence
6 28 (3.47%) Embedded Systems
7 26 (3.22%) Distributed Systems
8 21 (2.60%) Clustering
8 21 (2.60%) Cyberattack
8 21 (2.60%) MicroBlaze
8 21 (2.60%) RISC-V
9 16 (1.98%) Self-Motivation
10 15 (1.86%) Data Centre
11 13 (1.61%) Algorithms
12 12 (1.49%) Private Cloud
13 9 (1.12%) Cloud Native
13 9 (1.12%) Robotics
14 8 (0.99%) CCTV
14 8 (0.99%) Product Ownership
15 7 (0.87%) Reference Data
Operating Systems
1 134 (16.60%) Windows
2 116 (14.37%) Linux
3 56 (6.94%) Windows Server
4 29 (3.59%) Android
5 25 (3.10%) Embedded Linux
6 11 (1.36%) Red Hat Enterprise Linux
7 9 (1.12%) CentOS
8 7 (0.87%) Unix
8 7 (0.87%) Windows Server 2019
9 6 (0.74%) Apple iOS
9 6 (0.74%) Windows Server 2003
10 5 (0.62%) Windows 10
11 4 (0.50%) Ubuntu
12 2 (0.25%) Mac OS
Processes & Methodologies
1 177 (21.93%) Agile
2 93 (11.52%) Innovative Thinking
3 85 (10.53%) Software Engineering
4 78 (9.67%) Problem-Solving
5 77 (9.54%) Cybersecurity
6 57 (7.06%) DevOps
7 55 (6.82%) Mentoring
8 54 (6.69%) Signal Processing
9 52 (6.44%) Roadmaps
10 51 (6.32%) Customer Service
11 50 (6.20%) Continuous Improvement
11 50 (6.20%) Digital Signal Processing
11 50 (6.20%) Mathematics
12 48 (5.95%) Line Management
12 48 (5.95%) Risk Management
13 46 (5.70%) Infrastructure Engineering
14 45 (5.58%) Physics
15 44 (5.45%) Artificial Intelligence
15 44 (5.45%) CI/CD
16 43 (5.33%) Kanban
Programming Languages
1 94 (11.65%) PowerShell
2 92 (11.40%) Python
3 69 (8.55%) C++
4 61 (7.56%) Java
5 45 (5.58%) C
6 42 (5.20%) JavaScript
7 34 (4.21%) MATLAB
8 31 (3.84%) SQL
9 21 (2.60%) Go
10 19 (2.35%) Rust
11 17 (2.11%) Shell Script
12 14 (1.73%) Bash
13 10 (1.24%) TypeScript
14 9 (1.12%) PHP
15 7 (0.87%) PL/SQL
16 6 (0.74%) Fortran
17 5 (0.62%) C#
17 5 (0.62%) Embedded C
17 5 (0.62%) Kotlin
18 4 (0.50%) Kusto Query Language
Qualifications
1 524 (64.93%) SC Cleared
2 359 (44.49%) DV Cleared
3 91 (11.28%) Degree
4 38 (4.71%) Cisco Certification
5 30 (3.72%) CCNA
6 28 (3.47%) CCNP
7 22 (2.73%) Computer Science Degree
8 21 (2.60%) CISSP
9 17 (2.11%) HND
10 16 (1.98%) Master's Degree
11 15 (1.86%) JNCIA
12 13 (1.61%) PhD
13 10 (1.24%) CESG Certified Professional
14 9 (1.12%) VMware Certified Professional (VCP)
15 8 (0.99%) BPSS Clearance
15 8 (0.99%) JNCIS
15 8 (0.99%) Microsoft Certification
16 7 (0.87%) ISTQB
17 6 (0.74%) ISO 27001 Lead Auditor
17 6 (0.74%) TOGAF Certification
Quality Assurance & Compliance
1 24 (2.97%) SLA
2 23 (2.85%) ISO/IEC 27001
3 16 (1.98%) Def Stans
4 12 (1.49%) GDPR
5 11 (1.36%) COSHH
6 10 (1.24%) NIST
6 10 (1.24%) QA
7 9 (1.12%) Cyber Essentials
8 7 (0.87%) Data Quality
8 7 (0.87%) RMADS
9 6 (0.74%) Cyber Essentials PLUS
10 5 (0.62%) ISO/IEC 15288
11 3 (0.37%) HIPAA
11 3 (0.37%) ISO 9000
11 3 (0.37%) JSP 440
11 3 (0.37%) NCSC
11 3 (0.37%) PMBOK
11 3 (0.37%) SOC 2
12 2 (0.25%) Dublin Core
12 2 (0.25%) ISO 9001
System Software
1 90 (11.15%) VMware Infrastructure
2 89 (11.03%) Active Directory
3 75 (9.29%) Docker
4 66 (8.18%) Firmware
5 45 (5.58%) Embedded Firmware
6 31 (3.84%) vSphere
7 29 (3.59%) Hyper-V
8 24 (2.97%) VMware ESXi
9 22 (2.73%) VMware NSX
10 9 (1.12%) Virtual Machines
11 8 (0.99%) BitLocker
11 8 (0.99%) Microsoft App-V
11 8 (0.99%) Terminal Services
12 4 (0.50%) ISA Server
12 4 (0.50%) Virtual Desktop
13 3 (0.37%) Terminal Server
14 2 (0.25%) NFS
14 2 (0.25%) VMware Workstation
15 1 (0.12%) vCloud
Systems Management
1 78 (9.67%) Ansible
2 69 (8.55%) Kubernetes
3 44 (5.45%) Terraform
4 24 (2.97%) FortiGate
4 24 (2.97%) WMI
5 21 (2.60%) vCenter Server
6 14 (1.73%) vMotion
7 12 (1.49%) Active Directory Federation Services
7 12 (1.49%) Puppet
8 11 (1.36%) Single Sign-On
9 10 (1.24%) Kibana
10 9 (1.12%) SCCM
11 8 (0.99%) PowerCLI
11 8 (0.99%) vRealize
12 7 (0.87%) QRadar
12 7 (0.87%) SCOM
13 6 (0.74%) ArcSight ESM
13 6 (0.74%) Nagios
14 5 (0.62%) Grafana
14 5 (0.62%) Prometheus
Vendors
1 135 (16.73%) Cisco
2 123 (15.24%) VMware
3 121 (14.99%) Microsoft
4 119 (14.75%) Juniper
5 31 (3.84%) Fortinet
6 30 (3.72%) Splunk
7 25 (3.10%) SAP
8 21 (2.60%) McAfee
8 21 (2.60%) Sparx
9 18 (2.23%) SolarWinds
10 16 (1.98%) Citrix
11 13 (1.61%) Veeam
12 12 (1.49%) HP
13 11 (1.36%) Forcepoint
14 10 (1.24%) Dynatrace
15 9 (1.12%) SevOne
16 8 (0.99%) ArcSight
16 8 (0.99%) EMC
17 7 (0.87%) Atlassian
17 7 (0.87%) Thales