DV Cleared Jobs in the South East

Developed Vetting (DV) Clearance
England > South East

The table below provides summary statistics for permanent job vacancies advertised in the South East with a requirement for DV Cleared qualifications. It includes a benchmarking guide to the salaries offered over the 6 months leading up to 26 July 2024, comparing them to the same period in the previous two years.

6 months to
26 Jul 2024
Same period 2023 Same period 2022
Rank 68 116 260
Rank change year-on-year +48 +144 +24
Permanent jobs citing DV Cleared 510 328 280
As % of all permanent jobs advertised in the South East 3.38% 2.83% 1.27%
As % of the Qualifications category 10.59% 7.09% 3.39%
Number of salaries quoted 383 234 190
10th Percentile £35,000 £31,280 £32,750
25th Percentile £46,550 £37,750 £41,939
Median annual salary (50th Percentile) £56,252 £52,500 £55,500
Median % change year-on-year +7.15% -5.41% -13.95%
75th Percentile £77,500 £69,688 £73,750
90th Percentile £90,000 £76,250 £77,505
England median annual salary £57,500 £60,000 £56,787
% change year-on-year -4.17% +5.66% +3.25%

All Academic and Professional Certifications
South East

DV Cleared falls under the Academic Qualifications and Professional Certifications category. For comparison with the information above, the following table provides summary statistics for all permanent job vacancies requiring academic qualifications or professional certifications in the South East.

Permanent vacancies requiring academic qualifications or professional certifications 4,814 4,629 8,259
As % of all permanent jobs advertised in the South East 31.90% 39.95% 37.43%
Number of salaries quoted 2,888 2,312 3,312
10th Percentile £31,250 £29,250 £29,388
25th Percentile £40,000 £36,988 £37,500
Median annual salary (50th Percentile) £52,500 £52,000 £50,500
Median % change year-on-year +0.96% +2.97% +1.00%
75th Percentile £67,500 £66,250 £65,750
90th Percentile £83,750 £82,500 £80,000
England median annual salary £55,000 £60,000 £55,000
% change year-on-year -8.33% +9.09% -

DV Cleared
Job Vacancy Trend in the South East

Job postings citing DV Cleared as a proportion of all IT jobs advertised in the South East.
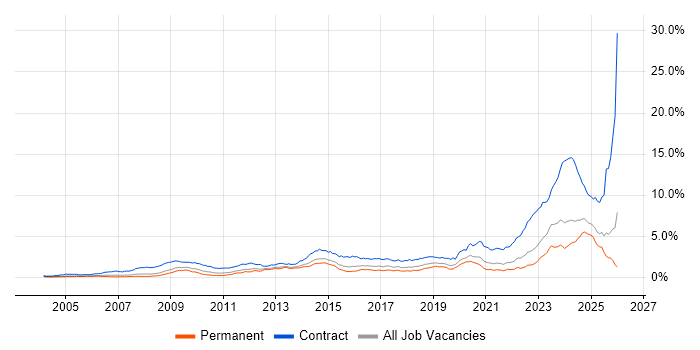
Job vacancy trend for DV Cleared in the South East

DV Cleared
Salary Trend in the South East

3-month moving average salary quoted in jobs citing DV Cleared in the South East.

Salary trend for DV Cleared in the South East

DV Cleared
Salary Histogram in the South East

Salary distribution for jobs citing DV Cleared in the South East over the 6 months to 26 July 2024.

Salary histogram for DV Cleared in the South East

DV Cleared
Job Locations in the South East

The table below looks at the demand and provides a guide to the median salaries quoted in IT jobs citing DV Cleared within the South East region over the 6 months to 26 July 2024. The 'Rank Change' column provides an indication of the change in demand within each location based on the same 6 month period last year.

Location Rank Change
on Same Period
Last Year
Matching
Permanent
IT Job Ads
Median Salary
Past 6 Months
Median Salary
% Change
on Same Period
Last Year
Live
Jobs
Hampshire +26 233 £59,500 -3.57% 51
Thames Valley +32 201 £52,500 +12.90% 22
Berkshire +15 179 £54,000 +16.13% 19
Surrey +16 68 £80,000 +23.08% 2
Buckinghamshire +6 14 £27,275 -39.65% 3
Oxfordshire -6 8 £44,982 -0.04%
East Sussex - 5 £92,500 -
West Sussex +20 2 - -
DV Cleared
England

DV Cleared
Co-occurring Skills and Capabilities in the South East by Category

The follow tables expand on the table above by listing co-occurrences grouped by category. The same employment type, locality and period is covered with up to 20 co-occurrences shown in each of the following categories:

Application Platforms
1 27 (5.29%) Microsoft Exchange
2 6 (1.18%) SharePoint
3 3 (0.59%) CMS
4 2 (0.39%) Confluence
4 2 (0.39%) IIS
5 1 (0.20%) Documentum
5 1 (0.20%) Exchange Server 2013
5 1 (0.20%) nginx
5 1 (0.20%) SharePoint Server
Applications
1 32 (6.27%) Simulink
2 28 (5.49%) Microsoft Office
3 2 (0.39%) Microsoft Project
Business Applications
1 1 (0.20%) Primavera
Cloud Services
1 62 (12.16%) Azure
2 30 (5.88%) Microsoft 365
3 21 (4.12%) Entra ID
4 20 (3.92%) Azure Monitor
5 16 (3.14%) Azure Storage
6 15 (2.94%) AWS
7 14 (2.75%) GCP
8 6 (1.18%) Azure DevOps
9 4 (0.78%) OCI
10 3 (0.59%) SaaS
11 1 (0.20%) Cloud Computing
Communications & Networking
1 32 (6.27%) DNS
2 30 (5.88%) Firewall
2 30 (5.88%) SSL
3 29 (5.69%) DHCP
4 25 (4.90%) Cisco Firepower
5 22 (4.31%) VPN
6 18 (3.53%) BGP
6 18 (3.53%) OSPF
7 17 (3.33%) Network Security
8 16 (3.14%) Ethernet VPN
9 15 (2.94%) EIGRP
10 14 (2.75%) Cisco ASA
11 13 (2.55%) Ethernet
11 13 (2.55%) IPsec
11 13 (2.55%) RIP
11 13 (2.55%) TCP/IP
11 13 (2.55%) VLAN
11 13 (2.55%) VXLAN
12 10 (1.96%) SNMP
13 8 (1.57%) SAN
Database & Business Intelligence
1 9 (1.76%) SQL Server
2 4 (0.78%) Big Data
2 4 (0.78%) Elasticsearch
3 3 (0.59%) Relational Database
4 2 (0.39%) NonStop SQL
4 2 (0.39%) PostgreSQL
5 1 (0.20%) MySQL
Development Applications
1 18 (3.53%) Selenium
2 17 (3.33%) MSI
3 13 (2.55%) AdminStudio
3 13 (2.55%) InstallShield
4 9 (1.76%) TestRail
5 5 (0.98%) eggPlant
5 5 (0.98%) GitLab
6 4 (0.78%) Robot Framework
7 3 (0.59%) JIRA
7 3 (0.59%) Sonatype Nexus
8 2 (0.39%) Git
9 1 (0.20%) Jenkins
9 1 (0.20%) JMeter
9 1 (0.20%) Maven
General
1 128 (25.10%) Social Skills
2 54 (10.59%) Aerospace
3 46 (9.02%) Finance
4 27 (5.29%) Public Sector
5 25 (4.90%) Analytical Skills
6 19 (3.73%) Organisational Skills
7 15 (2.94%) Electronics
8 13 (2.55%) Presentation Skills
9 9 (1.76%) Fire and Rescue
10 5 (0.98%) Advertising
11 4 (0.78%) Influencing Skills
11 4 (0.78%) Military
12 3 (0.59%) Back Office
12 3 (0.59%) Documentation Skills
12 3 (0.59%) Manufacturing
13 2 (0.39%) Multimedia
13 2 (0.39%) Publishing
13 2 (0.39%) Telecoms
14 1 (0.20%) Games
14 1 (0.20%) Marketing
Job Titles
1 70 (13.73%) Network Engineer
2 57 (11.18%) Architect
3 50 (9.80%) Developer
3 50 (9.80%) Embedded Developer
3 50 (9.80%) Embedded Software Developer
3 50 (9.80%) Software Developer
4 49 (9.61%) Integration Engineer
5 41 (8.04%) Systems Engineer
6 33 (6.47%) Infrastructure Engineer
7 25 (4.90%) Software Engineer
8 24 (4.71%) Analyst
9 20 (3.92%) Active Directory Specialist
9 20 (3.92%) Azure Specialist
10 19 (3.73%) DV Cleared Network Engineer
10 19 (3.73%) Senior
10 19 (3.73%) Tester
11 18 (3.53%) Application Integration Engineer
11 18 (3.53%) Applications Engineer
11 18 (3.53%) Automation Tester
11 18 (3.53%) Support Engineer
Libraries, Frameworks & Software Standards
1 16 (3.14%) ARM Templates
2 13 (2.55%) 802.1X
3 4 (0.78%) EDI
3 4 (0.78%) OLE
3 4 (0.78%) React
4 1 (0.20%) Django
4 1 (0.20%) Itk
Miscellaneous
1 40 (7.84%) Self-Motivation
2 37 (7.25%) PKI
3 18 (3.53%) Client/Server
4 16 (3.14%) Data Centre
5 14 (2.75%) VHDL
6 13 (2.55%) Algorithms
6 13 (2.55%) FPGA
6 13 (2.55%) Shadow IT
7 11 (2.16%) Greenfield Project
7 11 (2.16%) Management Information System
8 10 (1.96%) Analogue Electronics
8 10 (1.96%) Analytical Mindset
8 10 (1.96%) Blackberry
9 9 (1.76%) CMDB
10 8 (1.57%) Public Cloud
11 6 (1.18%) Private Cloud
11 6 (1.18%) Product Ownership
11 6 (1.18%) Video Conferencing
12 4 (0.78%) Clustering
12 4 (0.78%) Raspberry Pi
Operating Systems
1 152 (29.80%) Windows
2 106 (20.78%) Linux
3 99 (19.41%) Windows Server
4 43 (8.43%) Windows Server 2016
5 38 (7.45%) Windows Server 2019
6 36 (7.06%) Windows 10
7 35 (6.86%) Embedded Linux
8 18 (3.53%) CentOS
9 16 (3.14%) Windows 7
10 14 (2.75%) Windows Server 2012
11 13 (2.55%) Ubuntu
12 9 (1.76%) Windows NT
13 5 (0.98%) Windows Server 2008
14 4 (0.78%) Red Hat Enterprise Linux
14 4 (0.78%) Windows XP
15 1 (0.20%) Debian
15 1 (0.20%) Rocky
15 1 (0.20%) Solaris
Processes & Methodologies
1 138 (27.06%) Agile
2 75 (14.71%) Collaborative Working
2 75 (14.71%) DevOps
3 73 (14.31%) Problem-Solving
4 64 (12.55%) Infrastructure Engineering
5 63 (12.35%) Software Engineering
6 60 (11.76%) Release Management
7 56 (10.98%) ITIL
8 53 (10.39%) Service Management
9 48 (9.41%) Application Packaging
9 48 (9.41%) Artificial Intelligence
10 46 (9.02%) Signal Processing
11 44 (8.63%) Machine Learning
12 42 (8.24%) Computer Science
13 37 (7.25%) Analytics
13 37 (7.25%) Continuous Integration
14 36 (7.06%) Technical Analysis
14 36 (7.06%) Test Automation
15 35 (6.86%) System Testing
16 34 (6.67%) Coaching
Programming Languages
1 89 (17.45%) PowerShell
2 57 (11.18%) Python
3 48 (9.41%) Java
4 47 (9.22%) C
4 47 (9.22%) C++
5 35 (6.86%) C#
6 33 (6.47%) VB
7 20 (3.92%) VBScript
8 16 (3.14%) Bicep
9 15 (2.94%) JavaScript
10 8 (1.57%) SQL
11 7 (1.37%) Bash
11 7 (1.37%) Shell Script
12 5 (0.98%) Perl
12 5 (0.98%) TypeScript
13 4 (0.78%) PHP
14 3 (0.59%) MATLAB
15 1 (0.20%) Ruby
15 1 (0.20%) Rust
Qualifications
1 510 (100.00%) Security Cleared
2 282 (55.29%) SC Cleared
3 115 (22.55%) Degree
4 33 (6.47%) Cisco Certification
4 33 (6.47%) Computer Science Degree
5 27 (5.29%) CCNA
6 25 (4.90%) CCNP
7 16 (3.14%) ITIL Foundation Certificate
8 13 (2.55%) Microsoft Certification
9 11 (2.16%) HND
10 10 (1.96%) PhD
11 9 (1.76%) ISTQB
11 9 (1.76%) ISTQB Foundation Certification
12 8 (1.57%) CTC Cleared
13 6 (1.18%) A+ Certification
13 6 (1.18%) JNCIA
14 3 (0.59%) CISM
14 3 (0.59%) CISSP
14 3 (0.59%) MCP
14 3 (0.59%) Network+ Certification
Quality Assurance & Compliance
1 41 (8.04%) QA
2 8 (1.57%) NIST
3 7 (1.37%) SLA
4 5 (0.98%) ISO/IEC 27001
5 2 (0.39%) ISO/IEC 15288
6 1 (0.20%) Cyber Essentials
6 1 (0.20%) Cyber Essentials PLUS
6 1 (0.20%) PMO
System Software
1 81 (15.88%) Active Directory
2 55 (10.78%) VMware Infrastructure
3 16 (3.14%) Virtual Desktop
3 16 (3.14%) Virtual Machines
4 15 (2.94%) Hyper-V
5 14 (2.75%) Microsoft App-V
5 14 (2.75%) vSphere
6 13 (2.55%) Firmware
7 8 (1.57%) Docker
8 4 (0.78%) VMware ESXi
9 3 (0.59%) KVM
9 3 (0.59%) VMware NSX
Systems Management
1 51 (10.00%) WSUS
2 49 (9.61%) SCCM
3 35 (6.86%) Kubernetes
4 28 (5.49%) SCOM
5 20 (3.92%) Active Directory Federation Services
6 17 (3.33%) Microsoft Intune
6 17 (3.33%) vCenter Server
7 14 (2.75%) Terraform
8 11 (2.16%) Ansible
9 9 (1.76%) Sysprep
10 4 (0.78%) Cacti
10 4 (0.78%) EMC NetWorker
10 4 (0.78%) Grafana
10 4 (0.78%) Nagios
10 4 (0.78%) NetBackup
11 3 (0.59%) Nessus
11 3 (0.59%) WMI
12 2 (0.39%) FortiGate
13 1 (0.20%) Single Sign-On
Vendors
1 97 (19.02%) Microsoft
2 78 (15.29%) VMware
3 77 (15.10%) Cisco
4 38 (7.45%) Juniper
5 32 (6.27%) Xilinx
6 23 (4.51%) ServiceNow
7 16 (3.14%) Red Hat
8 14 (2.75%) Autodesk
8 14 (2.75%) Veeam
9 11 (2.16%) F5
9 11 (2.16%) McAfee
10 10 (1.96%) HP
11 7 (1.37%) Extreme Networks
12 6 (1.18%) Mitel
13 5 (0.98%) Dell
13 5 (0.98%) Dynatrace
13 5 (0.98%) EMC
13 5 (0.98%) Fortinet
13 5 (0.98%) Oracle
13 5 (0.98%) Palo Alto