Roadmaps Jobs in the South East

Roadmaps
England > South East

The table below provides summary statistics for permanent job vacancies advertised in the South East requiring Roadmaps skills. It includes a benchmarking guide to the annual salaries offered in vacancies that cited Roadmaps over the 6 months leading up to 21 June 2025, comparing them to the same period in the previous two years.

6 months to
21 Jun 2025
Same period 2024 Same period 2023
Rank 32 56 34
Rank change year-on-year +24 -22 +3
Permanent jobs citing Roadmaps 627 692 856
As % of all permanent jobs advertised in the South East 6.51% 3.64% 6.54%
As % of the Processes & Methodologies category 7.12% 4.48% 6.94%
Number of salaries quoted 156 355 596
10th Percentile £47,500 £43,750 £44,560
25th Percentile £57,313 £48,750 £52,500
Median annual salary (50th Percentile) £77,500 £60,500 £67,838
Median % change year-on-year +28.10% -10.82% +0.50%
75th Percentile £90,000 £76,250 £85,000
90th Percentile £101,250 £87,500 £100,000
England median annual salary £75,000 £70,000 £72,500
% change year-on-year +7.14% -3.45% +3.57%

All Process and Methodology Skills
South East

Roadmaps falls under the Processes and Methodologies category. For comparison with the information above, the following table provides summary statistics for all permanent job vacancies requiring process or methodology skills in the South East.

Permanent vacancies with a requirement for process or methodology skills 8,811 15,457 12,329
As % of all permanent jobs advertised in the South East 91.49% 81.31% 94.24%
Number of salaries quoted 4,401 10,562 7,485
10th Percentile £28,500 £27,786 £30,675
25th Percentile £37,500 £37,500 £41,250
Median annual salary (50th Percentile) £55,000 £50,000 £55,000
Median % change year-on-year +10.00% -9.09% -
75th Percentile £70,000 £65,000 £72,500
90th Percentile £80,000 £78,216 £85,000
England median annual salary £57,500 £55,000 £62,500
% change year-on-year +4.55% -12.00% +4.17%

Roadmaps
Job Vacancy Trend in the South East

Job postings citing Roadmaps as a proportion of all IT jobs advertised in the South East.
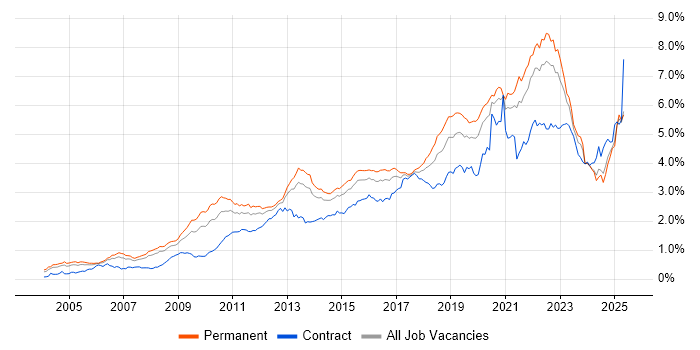
Job vacancy trend for Roadmaps in the South East

Roadmaps
Salary Trend in the South East

3-month moving average salary quoted in jobs citing Roadmaps in the South East.

Salary trend for Roadmaps in the South East

Roadmaps
Salary Histogram in the South East

Salary distribution for jobs citing Roadmaps in the South East over the 6 months to 21 June 2025.

Salary histogram for Roadmaps in the South East

Roadmaps
Job Locations in the South East

The table below looks at the demand and provides a guide to the median salaries quoted in IT jobs citing Roadmaps within the South East region over the 6 months to 21 June 2025. The 'Rank Change' column provides an indication of the change in demand within each location based on the same 6 month period last year.

Location Rank Change
on Same Period
Last Year
Matching
Permanent
IT Job Ads
Median Salary
Past 6 Months
Median Salary
% Change
on Same Period
Last Year
Live
Jobs
Thames Valley +42 299 £85,000 +53.15% 921
Berkshire +38 234 £85,000 +41.67% 582
Surrey +37 140 £77,500 +3.33% 213
Hampshire +42 85 £77,500 +24.00% 322
Middlesex -4 50 - - 3
Buckinghamshire +11 38 £87,500 +54.19% 210
East Sussex +7 30 £55,000 -19.71% 136
Oxfordshire +26 27 £80,000 +52.38% 132
Kent +40 16 £105,000 +100.00% 151
West Sussex -2 9 £80,437 +23.75% 134
Roadmaps
England

Roadmaps
Co-occurring Skills and Capabilities in the South East by Category

The follow tables expand on the table above by listing co-occurrences grouped by category. The same employment type, locality and period is covered with up to 20 co-occurrences shown in each of the following categories:

Application Platforms
1 17 (2.71%) Confluence
2 13 (2.07%) SharePoint
3 4 (0.64%) CMS
3 4 (0.64%) IBM Domino
4 3 (0.48%) Apache
4 3 (0.48%) Microsoft Exchange
5 2 (0.32%) Apache Spark
6 1 (0.16%) IIS
6 1 (0.16%) Oracle HTTP Server
6 1 (0.16%) Tomcat
6 1 (0.16%) WebLogic
Applications
1 12 (1.91%) Microsoft Excel
2 11 (1.75%) Microsoft Office
3 3 (0.48%) Microsoft Project
4 2 (0.32%) Microsoft PowerPoint
5 1 (0.16%) Chatbot
5 1 (0.16%) Spreadsheet
Business Applications
1 2 (0.32%) Dynamics CRM
2 1 (0.16%) Dynamics AX
2 1 (0.16%) Oracle EBS
2 1 (0.16%) Sage 200
Cloud Services
1 150 (23.92%) Azure
2 80 (12.76%) AWS
3 36 (5.74%) Vertex AI
4 31 (4.94%) GCP
5 25 (3.99%) Pulumi
6 24 (3.83%) Power Platform
7 23 (3.67%) Microsoft 365
8 18 (2.87%) Entra ID
9 17 (2.71%) Azure Monitor
9 17 (2.71%) SaaS
10 16 (2.55%) Azure DevOps
11 14 (2.23%) Azure Synapse Analytics
11 14 (2.23%) Salsify
12 13 (2.07%) Serverless
13 12 (1.91%) Azure Data Factory
14 11 (1.75%) AWS Lambda
15 10 (1.59%) Asana
15 10 (1.59%) Azure AI
15 10 (1.59%) Miro
16 8 (1.28%) PaaS
Communications & Networking
1 168 (26.79%) Broadband
2 11 (1.75%) SSH
2 11 (1.75%) SSL
3 10 (1.59%) WAN
4 7 (1.12%) Firewall
5 6 (0.96%) LAN
6 4 (0.64%) DNS
6 4 (0.64%) SD-WAN
6 4 (0.64%) VPN
6 4 (0.64%) Wireless
7 3 (0.48%) Bluetooth
7 3 (0.48%) Internet
8 2 (0.32%) NAS
9 1 (0.16%) 3G
9 1 (0.16%) GPRS
9 1 (0.16%) HTTP
9 1 (0.16%) LTE
9 1 (0.16%) Modbus
9 1 (0.16%) Network Security
Database & Business Intelligence
1 55 (8.77%) Data Lake
2 37 (5.90%) Data Mining
3 32 (5.10%) Relational Database
4 26 (4.15%) NoSQL
5 25 (3.99%) RDBMS
6 18 (2.87%) Metadata
6 18 (2.87%) Power BI
7 15 (2.39%) Data Warehouse
8 14 (2.23%) SQL Server
9 9 (1.44%) MongoDB
10 8 (1.28%) MySQL
11 3 (0.48%) PostgreSQL
11 3 (0.48%) Tableau
12 2 (0.32%) Apache Hive
12 2 (0.32%) Big Data
12 2 (0.32%) BigQuery
12 2 (0.32%) Bigtable
12 2 (0.32%) Hadoop
12 2 (0.32%) HBase
12 2 (0.32%) Impala
Development Applications
1 46 (7.34%) JIRA
2 25 (3.99%) Jaeger
3 11 (1.75%) Git
4 2 (0.32%) Bitbucket
4 2 (0.32%) ER Studio
5 1 (0.16%) ERwin
5 1 (0.16%) SQL Server Management Studio (SSMS)
General
1 322 (51.36%) Social Skills
2 199 (31.74%) Law
3 123 (19.62%) Analytical Skills
4 98 (15.63%) Finance
5 92 (14.67%) Influencing Skills
6 90 (14.35%) Legal
7 65 (10.37%) Inclusion and Diversity
8 54 (8.61%) Retail
9 45 (7.18%) Marketing
10 22 (3.51%) Aerospace
11 20 (3.19%) Public Sector
12 16 (2.55%) Games
13 14 (2.23%) Multimedia
14 11 (1.75%) Manufacturing
15 10 (1.59%) Presentation Skills
16 8 (1.28%) Back Office
17 6 (0.96%) Telecoms
18 5 (0.80%) Advertising
18 5 (0.80%) Banking
18 5 (0.80%) Electronics
Job Titles
1 218 (34.77%) Lead
2 170 (27.11%) Senior
3 42 (6.70%) Senior Manager
4 36 (5.74%) Team Leader
5 30 (4.78%) Architect
6 29 (4.63%) Systems Engineer
7 27 (4.31%) Engineering Manager
8 26 (4.15%) Developer
9 25 (3.99%) Analyst
9 25 (3.99%) Embedded Engineer
9 25 (3.99%) Release Engineer
10 22 (3.51%) Cloud Engineer
10 22 (3.51%) Product Manager
11 18 (2.87%) Head of AI
11 18 (2.87%) Head of Analytics
12 17 (2.71%) Product Owner
13 16 (2.55%) SAP Developer
14 14 (2.23%) Enterprise Architect
15 11 (1.75%) Business Analyst
15 11 (1.75%) DevOps Engineer
Libraries, Frameworks & Software Standards
1 28 (4.47%) Middleware
2 25 (3.99%) Elastic Stack
2 25 (3.99%) OpenTelemetry
3 16 (2.55%) SAPUI5
4 13 (2.07%) Hugging Face
4 13 (2.07%) LangChain
4 13 (2.07%) PyTorch
4 13 (2.07%) TensorFlow
5 12 (1.91%) React
5 12 (1.91%) RESTful
6 11 (1.75%) Web Services
7 10 (1.59%) Kafka
8 8 (1.28%) Laravel
9 7 (1.12%) HTML
10 6 (0.96%) CSS
11 5 (0.80%) .NET
12 4 (0.64%) AngularJS
12 4 (0.64%) REST
12 4 (0.64%) Vue
13 3 (0.48%) FHIR
Miscellaneous
1 58 (9.25%) Product Ownership
2 46 (7.34%) Management Information System
3 39 (6.22%) Analytical Mindset
4 38 (6.06%) Algorithms
5 25 (3.99%) Embedded Systems
6 21 (3.35%) Self-Motivation
6 21 (3.35%) Video\Live Streaming
7 15 (2.39%) Cyber Threat
8 14 (2.23%) Taxonomies
9 12 (1.91%) Onboarding
9 12 (1.91%) Over-the-Top Content
10 11 (1.75%) Cyberattack
10 11 (1.75%) PKI
11 9 (1.44%) Cloud Native
11 9 (1.44%) Operational Technology
12 8 (1.28%) Data Centre
12 8 (1.28%) Hybrid Cloud
12 8 (1.28%) IoT
13 7 (1.12%) Data Protection Act
13 7 (1.12%) Life Science
Operating Systems
1 30 (4.78%) Linux
2 25 (3.99%) Unix
3 9 (1.44%) Windows
4 6 (0.96%) Apple iOS
5 3 (0.48%) Red Hat Enterprise Linux
6 1 (0.16%) AIX
6 1 (0.16%) Android
6 1 (0.16%) SUSE
6 1 (0.16%) VMS
Processes & Methodologies
1 241 (38.44%) Problem-Solving
2 228 (36.36%) Agile
3 183 (29.19%) Product Management
4 164 (26.16%) Computer Science
5 161 (25.68%) Analytics
6 150 (23.92%) Mentoring
7 138 (22.01%) Artificial Intelligence
8 125 (19.94%) High Availability
9 123 (19.62%) Strategic Roadmap
10 111 (17.70%) DevOps
11 108 (17.22%) Machine Learning
12 106 (16.91%) Strategic Thinking
13 100 (15.95%) Data Science
14 85 (13.56%) Broadcast Engineering
14 85 (13.56%) Stakeholder Management
15 83 (13.24%) Stakeholder Engagement
16 74 (11.80%) Technology Roadmap
17 70 (11.16%) Decision-Making
18 63 (10.05%) Thought Leadership
19 62 (9.89%) Business Case
Programming Languages
1 66 (10.53%) Python
2 38 (6.06%) JavaScript
3 31 (4.94%) Java
4 26 (4.15%) Go
5 25 (3.99%) Bash
6 18 (2.87%) SQL
7 15 (2.39%) C#
8 10 (1.59%) PowerShell
9 9 (1.44%) PHP
10 5 (0.80%) TypeScript
11 4 (0.64%) Bicep
12 3 (0.48%) C
12 3 (0.48%) Embedded C
12 3 (0.48%) MATLAB
12 3 (0.48%) RPG
13 2 (0.32%) Ruby
14 1 (0.16%) Korn
14 1 (0.16%) T-SQL
Qualifications
1 212 (33.81%) Degree
2 114 (18.18%) Computer Science Degree
3 52 (8.29%) Security Cleared
4 46 (7.34%) SC Cleared
5 25 (3.99%) AWS Certification
6 21 (3.35%) Master's Degree
7 19 (3.03%) DV Cleared
8 15 (2.39%) CISSP
9 12 (1.91%) CISM
10 11 (1.75%) Azure Certification
11 9 (1.44%) CRISC
12 7 (1.12%) Microsoft Certification
13 6 (0.96%) TOGAF Certification
14 5 (0.80%) PMP
15 4 (0.64%) DBS Check
16 3 (0.48%) BPSS Clearance
17 2 (0.32%) CISA
17 2 (0.32%) PMI Certification
18 1 (0.16%) ISSEP
18 1 (0.16%) SSCP
Quality Assurance & Compliance
1 31 (4.94%) ISO/IEC 27001
2 20 (3.19%) Data Quality
3 18 (2.87%) NIST
4 12 (1.91%) GDPR
5 11 (1.75%) Cyber Essentials
6 9 (1.44%) Cyber Essentials PLUS
7 7 (1.12%) ISO/IEC 27002 (supersedes ISO/IEC 17799)
8 6 (0.96%) Def Stans
8 6 (0.96%) PCI DSS
9 4 (0.64%) Accessibility
9 4 (0.64%) PMO
10 3 (0.48%) 21 CFR Part 11
10 3 (0.48%) Good Clinical Practice
10 3 (0.48%) QA
10 3 (0.48%) Sarbanes-Oxley
10 3 (0.48%) SOC 2
11 2 (0.32%) HIPAA
12 1 (0.16%) ISO 22301
12 1 (0.16%) RMADS
12 1 (0.16%) WCAG
System Software
1 30 (4.78%) Docker
2 23 (3.67%) Active Directory
3 20 (3.19%) Virtual Machines
4 7 (1.12%) Virtual Desktop
5 2 (0.32%) HDFS
5 2 (0.32%) VMware Infrastructure
6 1 (0.16%) Firmware
Systems Management
1 52 (8.29%) Terraform
2 39 (6.22%) Prometheus
3 31 (4.94%) Ansible
4 30 (4.78%) Kubernetes
5 25 (3.99%) Argo
5 25 (3.99%) Kustomize
6 14 (2.23%) Grafana
7 9 (1.44%) Microsoft Intune
8 4 (0.64%) Single Sign-On
9 2 (0.32%) EMC VPLEX
9 2 (0.32%) Hadoop YARN
10 1 (0.16%) CASB
Vendors
1 128 (20.41%) Microsoft
2 67 (10.69%) Google
3 61 (9.73%) SAP
4 41 (6.54%) OpenAI
5 27 (4.31%) Salesforce
6 22 (3.51%) IBM
7 19 (3.03%) Databricks
8 11 (1.75%) Thales
9 10 (1.59%) Anaplan
9 10 (1.59%) Cisco
10 9 (1.44%) ServiceNow
11 8 (1.28%) Palo Alto
11 8 (1.28%) VMware
12 7 (1.12%) Foundry
12 7 (1.12%) Oracle
12 7 (1.12%) Rockwell
12 7 (1.12%) Siemens
13 6 (0.96%) Apple
13 6 (0.96%) Aruba
13 6 (0.96%) Citrix