Cadence
UK

The table below provides summary statistics for permanent job vacancies with a requirement for knowledge and experience of Cadence products and/or services. Included is a benchmarking guide to the salaries offered in vacancies that have cited Cadence over the 6 months to 1 December 2023 with a comparison to the same period in the previous 2 years.

The figures below represent the IT labour market in general and are not representative of salaries within Cadence Design Systems.

6 months to
1 Dec 2023
Same period 2022 Same period 2021
Rank 686 704 901
Rank change year-on-year +18 +197 -207
Permanent jobs citing Cadence 58 406 195
As % of all permanent jobs advertised in the UK 0.11% 0.32% 0.15%
As % of the Vendors category 0.26% 0.79% 0.38%
Number of salaries quoted 34 161 77
10th Percentile £51,526 £48,400 £35,934
25th Percentile £58,314 £55,000 £48,750
Median annual salary (50th Percentile) £80,294 £82,500 £65,000
Median % change year-on-year -2.67% +26.92% +36.84%
75th Percentile £89,577 £107,500 £77,500
90th Percentile £137,375 £117,236 £97,250
UK excluding London median annual salary £65,000 £60,000 £57,500
% change year-on-year +8.33% +4.35% +21.05%

All Vendors
UK

Cadence is in the Vendor Products and Services category. The following table is for comparison with the above and provides summary statistics for all permanent job vacancies with a requirement for knowledge or experience of vendor products and services.

Permanent vacancies with a requirement for knowledge or experience of vendor products and services 22,490 51,386 50,686
As % of all permanent jobs advertised in the UK 41.89% 41.02% 39.15%
Number of salaries quoted 16,488 30,144 33,490
10th Percentile £29,000 £31,250 £30,000
25th Percentile £40,000 £41,250 £39,250
Median annual salary (50th Percentile) £55,000 £57,500 £55,000
Median % change year-on-year -4.35% +4.55% +4.76%
75th Percentile £73,750 £77,500 £73,750
90th Percentile £91,934 £95,000 £87,600
UK excluding London median annual salary £49,502 £50,000 £47,500
% change year-on-year -1.00% +5.26% +4.40%

Cadence
Job Vacancy Trend

Job postings citing Cadence as a proportion of all IT jobs advertised.
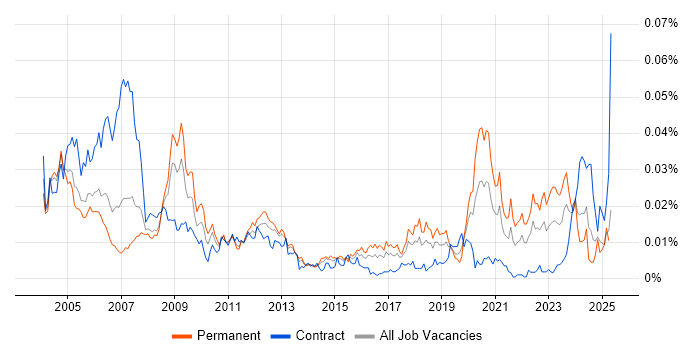
Job vacancy trend for Cadence in the UK

Cadence
Salary Trend

3-month moving average salary quoted in jobs citing Cadence.

Salary trend for Cadence in the UK

Cadence
Salary Histogram

Salary distribution for jobs citing Cadence over the 6 months to 1 December 2023.

Salary histogram for Cadence in the UK

Cadence
Top 14 Job Locations

The table below looks at the demand and provides a guide to the median salaries quoted in IT jobs citing Cadence within the UK over the 6 months to 1 December 2023. The 'Rank Change' column provides an indication of the change in demand within each location based on the same 6 month period last year.

Location Rank Change
on Same Period
Last Year
Matching
Permanent
IT Job Ads
Median Salary
Past 6 Months
Median Salary
% Change
on Same Period
Last Year
Live
Jobs
England +40 57 £80,294 +18.95% 103
UK excluding London +72 44 £65,000 +8.33% 83
South East +157 20 £57,500 -11.54% 29
Work from Home +126 15 £85,000 +3.03% 31
London +135 14 £101,250 +14.45% 28
North of England +106 10 £62,500 +13.64% 12
Yorkshire +87 7 - - 1
South West +80 6 £85,000 +70.95% 5
Midlands +32 6 £65,000 +20.93% 10
North West +88 3 £62,500 -9.09% 10
West Midlands +46 3 - - 9
East Midlands +42 3 £65,000 +30.00% 1
East of England +97 1 - - 20
Scotland 0 1 - - 6

Cadence
Co-occurring Skills and Capabilities by Category

The follow tables expand on the table above by listing co-occurrences grouped by category. The same employment type, locality and period is covered with up to 20 co-occurrences shown in each of the following categories:

Application Platforms
1 3 (5.17%) Confluence
2 1 (1.72%) SharePoint
Applications
1 8 (13.79%) OrCAD
2 6 (10.34%) Microsoft Office
3 1 (1.72%) Microsoft Excel
3 1 (1.72%) Microsoft PowerPoint
Cloud Services
1 6 (10.34%) Azure
2 4 (6.90%) AWS
3 3 (5.17%) Snowflake
4 2 (3.45%) Azure DevOps
5 1 (1.72%) Microsoft 365
5 1 (1.72%) Power Platform
5 1 (1.72%) SaaS
5 1 (1.72%) SuccessFactors
Communications & Networking
1 6 (10.34%) Software-Defined Radio
2 4 (6.90%) Broadband
2 4 (6.90%) Wireless
Database & Business Intelligence
1 4 (6.90%) SQL Server
2 3 (5.17%) PostgreSQL
3 1 (1.72%) Power BI
3 1 (1.72%) Relational Database
3 1 (1.72%) SQL Server Integration Services
Development Applications
1 7 (12.07%) JIRA
2 6 (10.34%) Rational DOORS
3 4 (6.90%) Jenkins
4 3 (5.17%) SonarQube
5 2 (3.45%) Git
5 2 (3.45%) Visual Studio
6 1 (1.72%) Gerrit
General
1 20 (34.48%) Social Skills
2 12 (20.69%) Finance
3 11 (18.97%) Electronics
3 11 (18.97%) Manufacturing
4 10 (17.24%) Inclusion and Diversity
5 9 (15.52%) Legal
6 6 (10.34%) Banking
6 6 (10.34%) Military
6 6 (10.34%) Public Sector
7 4 (6.90%) Retail
8 3 (5.17%) Analytical Skills
8 3 (5.17%) Automotive
9 2 (3.45%) Investment Banking
9 2 (3.45%) Marketing
9 2 (3.45%) Telecoms
10 1 (1.72%) Aerospace
10 1 (1.72%) Back Office
10 1 (1.72%) Front Office
10 1 (1.72%) Influencing Skills
10 1 (1.72%) Presentation Skills
Job Titles
1 14 (24.14%) Lead
2 7 (12.07%) IT Manager
3 6 (10.34%) Lead Systems Engineer
3 6 (10.34%) Senior
3 6 (10.34%) Systems Engineer
4 4 (6.90%) IC Layout Engineer
5 3 (5.17%) Full Stack Engineer
5 3 (5.17%) Full Stack Software Engineer
5 3 (5.17%) Programme Director
5 3 (5.17%) Site Reliability Engineer
5 3 (5.17%) Software Engineer
6 2 (3.45%) Analyst
6 2 (3.45%) Audio Engineer
6 2 (3.45%) Delivery Manager
6 2 (3.45%) Developer
6 2 (3.45%) Embedded C++ Engineer
6 2 (3.45%) Embedded Engineer
6 2 (3.45%) Graduate
6 2 (3.45%) Junior
6 2 (3.45%) Site Engineer
Libraries, Frameworks & Software Standards
1 4 (6.90%) .NET
1 4 (6.90%) JSON
1 4 (6.90%) REST
2 3 (5.17%) AngularJS
2 3 (5.17%) CSS
2 3 (5.17%) Ember.js
2 3 (5.17%) HTML
2 3 (5.17%) jQuery
2 3 (5.17%) React
2 3 (5.17%) SOAP
2 3 (5.17%) Twitter Bootstrap
2 3 (5.17%) XML
3 2 (3.45%) Spring
3 2 (3.45%) STL
4 1 (1.72%) J2EE
4 1 (1.72%) RESTful
4 1 (1.72%) Spring Boot
4 1 (1.72%) Velocity
Miscellaneous
1 9 (15.52%) e-Learning
2 7 (12.07%) FPGA
2 7 (12.07%) VHDL
3 6 (10.34%) Embedded Systems
3 6 (10.34%) Onboarding
4 5 (8.62%) Product Ownership
5 4 (6.90%) IoT
6 3 (5.17%) DataPower
6 3 (5.17%) Enterprise Software
6 3 (5.17%) Verilog
6 3 (5.17%) Wiki
7 2 (3.45%) Algorithms
7 2 (3.45%) Analogue Electronics
7 2 (3.45%) Infotainment
7 2 (3.45%) Management Information System
8 1 (1.72%) Foreign Exchange (FX)
8 1 (1.72%) Mali
8 1 (1.72%) Smartphone
Operating Systems
1 1 (1.72%) Linux
1 1 (1.72%) Unix
Processes & Methodologies
1 24 (41.38%) Agile
2 19 (32.76%) Problem-Solving
3 15 (25.86%) Continuous Improvement
4 14 (24.14%) Coaching
5 13 (22.41%) Software Engineering
6 12 (20.69%) Scrum
7 11 (18.97%) Computer Science
8 9 (15.52%) Attestation
8 9 (15.52%) Creative Thinking
8 9 (15.52%) Cybersecurity
8 9 (15.52%) Innovative Thinking
8 9 (15.52%) Performance Management
8 9 (15.52%) QMS
8 9 (15.52%) Risk Management
8 9 (15.52%) Strategic Thinking
8 9 (15.52%) Use Case
9 8 (13.79%) Configuration Management
9 8 (13.79%) DevOps
9 8 (13.79%) Systems Engineering
10 7 (12.07%) Change Management
Programming Languages
1 8 (13.79%) MATLAB
2 6 (10.34%) Java
3 4 (6.90%) JavaScript
3 4 (6.90%) SQL
4 3 (5.17%) T-SQL
5 2 (3.45%) C
5 2 (3.45%) C++
5 2 (3.45%) Embedded C++
6 1 (1.72%) C#
6 1 (1.72%) Perl
6 1 (1.72%) Python
6 1 (1.72%) SystemVerilog
6 1 (1.72%) Tcl
Qualifications
1 20 (34.48%) Degree
2 9 (15.52%) CISA
2 9 (15.52%) CRISC
3 7 (12.07%) Security Cleared
4 6 (10.34%) SC Cleared
5 1 (1.72%) AWS Certification
5 1 (1.72%) AWS Certified Cloud Practitioner
5 1 (1.72%) PMP
Quality Assurance & Compliance
1 11 (18.97%) GDPR
2 9 (15.52%) GRC
2 9 (15.52%) HIPAA
2 9 (15.52%) ISO/IEC 27001
2 9 (15.52%) NIST
2 9 (15.52%) Sarbanes-Oxley
3 4 (6.90%) PMO
4 2 (3.45%) ISO 26262
4 2 (3.45%) ISO/IEC 15288
5 1 (1.72%) Accessibility
5 1 (1.72%) DO-254
5 1 (1.72%) WCAG
System Software
1 1 (1.72%) Docker
1 1 (1.72%) Firmware
Vendors
1 6 (10.34%) Microsoft
1 6 (10.34%) SAP
2 4 (6.90%) Oracle
3 1 (1.72%) NCR
3 1 (1.72%) Siemens
3 1 (1.72%) Synopsys
3 1 (1.72%) Thales