Mentoring Jobs

Mentorship
UK

The table below provides summary statistics for permanent job vacancies requiring Mentoring skills. It includes a benchmarking guide to the annual salaries offered in vacancies that cited Mentoring over the 6 months leading up to 15 March 2025, comparing them to the same period in the previous two years.

6 months to
15 Mar 2025
Same period 2024 Same period 2023
Rank 22 24 16
Rank change year-on-year +2 -8 +12
Permanent jobs citing Mentoring 4,262 6,729 12,990
As % of all permanent jobs advertised in the UK 7.84% 7.70% 11.69%
As % of the Processes & Methodologies category 8.34% 8.77% 12.22%
Number of salaries quoted 2,083 4,748 4,836
10th Percentile £38,750 £35,000 £40,792
25th Percentile £51,250 £44,851 £52,500
Median annual salary (50th Percentile) £65,000 £62,783 £70,000
Median % change year-on-year +3.53% -10.31% +11.18%
75th Percentile £81,875 £81,250 £87,500
90th Percentile £100,000 £97,875 £105,000
UK excluding London median annual salary £62,500 £57,965 £64,029
% change year-on-year +7.82% -9.47% +11.35%

All Process and Methodology Skills
UK

Mentoring falls under the Processes and Methodologies category. For comparison with the information above, the following table provides summary statistics for all permanent job vacancies requiring process or methodology skills.

Permanent vacancies with a requirement for process or methodology skills 51,094 76,717 106,265
As % of all permanent jobs advertised in the UK 94.00% 87.74% 95.67%
Number of salaries quoted 25,702 56,130 62,837
10th Percentile £32,500 £29,000 £34,481
25th Percentile £45,000 £40,000 £45,300
Median annual salary (50th Percentile) £58,984 £55,000 £62,500
Median % change year-on-year +7.24% -12.00% +4.17%
75th Percentile £77,500 £73,750 £82,500
90th Percentile £100,000 £93,750 £100,000
UK excluding London median annual salary £54,000 £50,000 £55,000
% change year-on-year +8.00% -9.09% +4.76%

Mentoring
Job Vacancy Trend

Job postings citing Mentoring as a proportion of all IT jobs advertised.
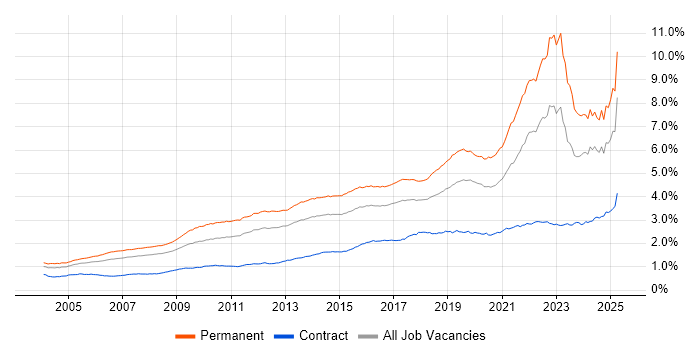
Job vacancy trend for Mentoring in the UK

Mentoring
Salary Trend

3-month moving average salary quoted in jobs citing Mentoring.

Salary trend for Mentoring in the UK

Mentoring
Salary Histogram

Salary distribution for jobs citing Mentoring over the 6 months to 15 March 2025.

Salary histogram for Mentoring in the UK

Mentoring
Top 18 Job Locations

The table below looks at the demand and provides a guide to the median salaries quoted in IT jobs citing Mentoring within the UK over the 6 months to 15 March 2025. The 'Rank Change' column provides an indication of the change in demand within each location based on the same 6 month period last year.

Location Rank Change
on Same Period
Last Year
Matching
Permanent
IT Job Ads
Median Salary
Past 6 Months
Median Salary
% Change
on Same Period
Last Year
Live
Jobs
England +3 3,806 £65,000 +3.53% 4,763
UK excluding London +3 2,758 £62,500 +7.82% 2,327
Work from Home +2 1,684 £65,000 - 2,394
London +5 1,328 £77,500 -3.13% 2,740
North of England -15 719 £62,500 +4.17% 751
Midlands +9 592 £61,660 +23.32% 334
South East +1 576 £62,000 +6.90% 541
North West -18 448 £62,500 +7.82% 455
West Midlands +10 409 £62,307 +7.49% 178
South West +5 299 £61,500 +6.96% 255
Scotland +12 271 £55,000 -15.38% 148
East of England +16 227 £65,000 +13.04% 228
Yorkshire -16 199 £67,500 +5.88% 208
East Midlands +8 181 £60,000 +33.33% 151
Wales +3 72 £65,000 +11.30% 58
North East -13 72 £55,000 -12.20% 90
Northern Ireland -7 11 £85,000 +70.00% 41
Channel Islands - 1 £97,500 -

Mentoring
Co-occurring Skills and Capabilities by Category

The follow tables expand on the table above by listing co-occurrences grouped by category. The same employment type, locality and period is covered with up to 20 co-occurrences shown in each of the following categories:

Application Platforms
1 81 (1.90%) SharePoint
2 72 (1.69%) Microsoft Exchange
3 61 (1.43%) Confluence
4 57 (1.34%) Apache
5 39 (0.92%) CMS
6 25 (0.59%) Jupyter
7 20 (0.47%) Apache Spark
8 15 (0.35%) IIS
8 15 (0.35%) nginx
8 15 (0.35%) OpenEdge
9 12 (0.28%) Apache Airflow
10 10 (0.23%) Umbraco
11 9 (0.21%) Apache Solr
12 8 (0.19%) Camunda
12 8 (0.19%) SAS
13 7 (0.16%) Sitecore CMS
14 5 (0.12%) OpenStack
14 5 (0.12%) WordPress
15 4 (0.094%) Oracle SOA Suite
16 3 (0.070%) Adobe Experience Manager
Applications
1 150 (3.52%) Microsoft Excel
2 128 (3.00%) Microsoft Office
3 30 (0.70%) Microsoft PowerPoint
4 27 (0.63%) Microsoft Project
5 16 (0.38%) MS Visio
6 15 (0.35%) AutoCAD
7 11 (0.26%) Chatbot
8 10 (0.23%) Trello
9 8 (0.19%) Maya
9 8 (0.19%) Simulink
10 7 (0.16%) Sketch
11 6 (0.14%) Adobe XD
12 4 (0.094%) Adobe Creative Suite
13 3 (0.070%) Spreadsheet
14 2 (0.047%) Adobe Illustrator
14 2 (0.047%) GNU Octave
14 2 (0.047%) InDesign
14 2 (0.047%) Moqups
14 2 (0.047%) Photoshop
14 2 (0.047%) UserZoom
Business Applications
1 45 (1.06%) Dynamics CRM
2 24 (0.56%) Ripple
2 24 (0.56%) Ripple XRP
3 16 (0.38%) Oracle EBS
4 15 (0.35%) Dynamics AX
5 13 (0.31%) Oracle ERP
6 11 (0.26%) Salesforce CRM
7 10 (0.23%) SAP S/4HANA
8 7 (0.16%) Oracle Applications
9 6 (0.14%) PeopleSoft HCM
10 4 (0.094%) iTrent
10 4 (0.094%) NEC Housing
10 4 (0.094%) Orchestrade
10 4 (0.094%) Relativity
10 4 (0.094%) Ringtail
10 4 (0.094%) Veritas eDiscovery
11 3 (0.070%) CA PPM
11 3 (0.070%) Magento
12 2 (0.047%) SAP EWM
12 2 (0.047%) Shopify
Cloud Services
1 850 (19.94%) Azure
2 695 (16.31%) AWS
3 237 (5.56%) GCP
3 237 (5.56%) Power Platform
4 189 (4.43%) SaaS
5 184 (4.32%) Azure DevOps
6 172 (4.04%) Microsoft 365
7 135 (3.17%) Serverless
8 133 (3.12%) GitHub
9 97 (2.28%) Cloud Computing
10 89 (2.09%) AWS Lambda
11 85 (1.99%) Amazon S3
12 71 (1.67%) PaaS
13 70 (1.64%) Dynamics 365
14 59 (1.38%) GitHub Actions
15 56 (1.31%) Entra ID
16 51 (1.20%) AWS CloudFormation
17 50 (1.17%) IaaS
18 44 (1.03%) PowerApps
19 40 (0.94%) Snowflake
Communications & Networking
1 248 (5.82%) Network Security
2 201 (4.72%) Internet
3 168 (3.94%) WLAN
4 144 (3.38%) Broadband
5 131 (3.07%) Firewall
6 119 (2.79%) Intrusion Detection
7 61 (1.43%) VPN
8 60 (1.41%) WAN
9 55 (1.29%) DNS
10 51 (1.20%) Wi-Fi
11 46 (1.08%) LAN
11 46 (1.08%) TCP/IP
12 40 (0.94%) DHCP
13 35 (0.82%) SD-WAN
14 24 (0.56%) Unified Communications
14 24 (0.56%) Wireless
15 22 (0.52%) Structured Cabling
15 22 (0.52%) VoIP
16 19 (0.45%) HTTP
17 16 (0.38%) VLAN
Database & Business Intelligence
1 175 (4.11%) SQL Server
2 161 (3.78%) Power BI
3 159 (3.73%) MongoDB
4 130 (3.05%) NoSQL
5 123 (2.89%) MySQL
6 119 (2.79%) Relational Database
7 117 (2.75%) PostgreSQL
8 103 (2.42%) Tableau
9 94 (2.21%) Data Warehouse
10 78 (1.83%) Data Lake
11 67 (1.57%) Big Data
12 59 (1.38%) DynamoDB
13 47 (1.10%) SQL Server Integration Services
14 43 (1.01%) Elasticsearch
15 38 (0.89%) SQL Server Reporting Services
16 36 (0.84%) Amazon Aurora
16 36 (0.84%) Azure SQL Database
17 32 (0.75%) Amazon RDS
18 31 (0.73%) RDBMS
19 30 (0.70%) Amazon Redshift
Development Applications
1 251 (5.89%) Git
2 157 (3.68%) JIRA
3 128 (3.00%) Jenkins
4 114 (2.67%) Rational DOORS
5 105 (2.46%) GitLab
6 64 (1.50%) Selenium
7 43 (1.01%) SonarQube
8 38 (0.89%) Eclipse
9 35 (0.82%) Eclipse RCP
10 30 (0.70%) Visual Studio
11 26 (0.61%) Postman
12 19 (0.45%) Maven
12 19 (0.45%) webpack
13 17 (0.40%) Bitbucket
14 16 (0.38%) JUnit
15 14 (0.33%) Cypress.io
16 13 (0.31%) CircleCI
16 13 (0.31%) Oracle Forms
16 13 (0.31%) TeamCity
17 11 (0.26%) SoapUI
General
1 1,513 (35.50%) Social Skills
2 1,154 (27.08%) Finance
3 598 (14.03%) Analytical Skills
4 495 (11.61%) Inclusion and Diversity
5 241 (5.65%) Telecoms
6 233 (5.47%) Marketing
7 231 (5.42%) Banking
8 224 (5.26%) Law
9 216 (5.07%) Retail
10 204 (4.79%) Manufacturing
11 195 (4.58%) Legal
12 170 (3.99%) Games
13 159 (3.73%) Public Sector
14 134 (3.14%) Organisational Skills
15 93 (2.18%) Influencing Skills
16 92 (2.16%) Electronics
17 87 (2.04%) Advertising
18 76 (1.78%) Presentation Skills
19 58 (1.36%) Financial Institution
20 49 (1.15%) Tech for Good
Job Titles
1 1,277 (29.96%) Senior
2 852 (19.99%) Lead
3 385 (9.03%) Developer
4 355 (8.33%) Architect
5 316 (7.41%) Software Engineer
6 271 (6.36%) Audit Manager
7 242 (5.68%) Senior Manager
8 209 (4.90%) IT Support
9 208 (4.88%) Support Engineer
10 183 (4.29%) IT Engineer
11 181 (4.25%) Team Leader
12 179 (4.20%) Analyst
13 173 (4.06%) IT Support Engineer
14 141 (3.31%) Senior Developer
15 123 (2.89%) Senior Audit Manager
16 122 (2.86%) Security Architect
17 121 (2.84%) Senior Software Engineer
18 108 (2.53%) Lead Developer
18 108 (2.53%) Systems Engineer
19 99 (2.32%) Project Manager
Libraries, Frameworks & Software Standards
1 333 (7.81%) .NET
2 309 (7.25%) React
3 301 (7.06%) HTML
4 218 (5.11%) Node.js
5 180 (4.22%) CSS
6 158 (3.71%) AngularJS
7 131 (3.07%) RESTful
8 100 (2.35%) REST
9 97 (2.28%) Kafka
10 96 (2.25%) Spring
11 84 (1.97%) Spring Boot
12 81 (1.90%) Elastic Stack
13 71 (1.67%) Middleware
14 69 (1.62%) .NET Framework
15 63 (1.48%) .NET Core
16 61 (1.43%) Vue
17 55 (1.29%) GraphQL
18 48 (1.13%) Next.js
19 46 (1.08%) ASP.NET
20 42 (0.99%) XML
Miscellaneous
1 369 (8.66%) Management Information System
2 215 (5.04%) Driving Licence
3 171 (4.01%) Product Ownership
4 165 (3.87%) Algorithms
5 153 (3.59%) Cyberattack
6 112 (2.63%) Cloud Native
7 107 (2.51%) Onboarding
8 106 (2.49%) Blockchain
9 93 (2.18%) Private Cloud
10 87 (2.04%) Self-Motivation
11 80 (1.88%) Virtual Team
12 71 (1.67%) Public Cloud
13 66 (1.55%) IoT
14 62 (1.45%) Greenfield Project
15 55 (1.29%) Digital Media
16 52 (1.22%) Robotics
17 49 (1.15%) Distributed Systems
17 49 (1.15%) Enterprise Software
18 46 (1.08%) Hybrid Cloud
18 46 (1.08%) Legacy Systems
Operating Systems
1 459 (10.77%) Linux
2 441 (10.35%) Windows
3 72 (1.69%) Unix
4 69 (1.62%) Windows Server
5 58 (1.36%) Apple iOS
6 52 (1.22%) Android
7 22 (0.52%) Windows 10
8 20 (0.47%) Mac OS
9 19 (0.45%) Windows Server 2019
10 16 (0.38%) Red Hat Enterprise Linux
11 15 (0.35%) Windows Server 2016
12 13 (0.31%) VMS
13 6 (0.14%) CentOS
13 6 (0.14%) Ubuntu
13 6 (0.14%) Windows Vista
14 5 (0.12%) Windows Server 2012
15 3 (0.070%) Data ONTAP
15 3 (0.070%) zOS
16 2 (0.047%) CoreOS
16 2 (0.047%) Oracle Linux
Processes & Methodologies
1 1,419 (33.29%) Agile
2 1,237 (29.02%) Coaching
3 1,221 (28.65%) Problem-Solving
4 840 (19.71%) Software Engineering
5 804 (18.86%) DevOps
6 632 (14.83%) CI/CD
7 590 (13.84%) Continuous Improvement
8 547 (12.83%) Creative Thinking
9 538 (12.62%) Computer Science
10 534 (12.53%) Project Management
11 469 (11.00%) Roadmaps
12 432 (10.14%) Analytics
13 426 (10.00%) Technical Leadership
14 380 (8.92%) Microservices
15 379 (8.89%) Artificial Intelligence
16 359 (8.42%) Risk Management
17 357 (8.38%) Cybersecurity
18 342 (8.02%) ITIL
19 295 (6.92%) Test Automation
20 291 (6.83%) Containerisation
Programming Languages
1 634 (14.88%) Python
2 525 (12.32%) SQL
3 434 (10.18%) Java
4 430 (10.09%) JavaScript
5 393 (9.22%) C#
6 244 (5.73%) TypeScript
7 131 (3.07%) C++
8 130 (3.05%) PowerShell
9 129 (3.03%) Bash
10 105 (2.46%) Shell Script
11 102 (2.39%) R
12 93 (2.18%) C
13 85 (1.99%) PHP
14 47 (1.10%) Go
15 41 (0.96%) Ruby
16 36 (0.84%) Rust
17 33 (0.77%) VBA
18 32 (0.75%) PL/SQL
19 30 (0.70%) Kotlin
20 29 (0.68%) SystemVerilog
Qualifications
1 1,069 (25.08%) Degree
2 398 (9.34%) Computer Science Degree
2 398 (9.34%) Security Cleared
3 249 (5.84%) BPSS Clearance
4 237 (5.56%) LPIC
5 210 (4.93%) Microsoft Certification
6 208 (4.88%) Cisco Certification
7 196 (4.60%) CCNA
8 194 (4.55%) DV Cleared
9 176 (4.13%) CCNP
10 164 (3.85%) MCP
11 163 (3.82%) MCSE
12 158 (3.71%) Master's Degree
13 120 (2.82%) SC Cleared
14 118 (2.77%) Chartered Engineer
15 91 (2.14%) CISSP
16 89 (2.09%) ACCA
17 70 (1.64%) CISA
18 69 (1.62%) RHCSA
19 60 (1.41%) AWS Certification
Quality Assurance & Compliance
1 392 (9.20%) QA
2 128 (3.00%) Accessibility
3 120 (2.82%) NIST
4 112 (2.63%) ISO/IEC 15288
5 109 (2.56%) Data Quality
5 109 (2.56%) IFRS
6 104 (2.44%) GAAP
7 90 (2.11%) ISO/IEC 27001
8 86 (2.02%) SOC 2
9 64 (1.50%) ITGC
10 59 (1.38%) GDPR
11 36 (0.84%) NCSC
12 34 (0.80%) Cyber Essentials
13 33 (0.77%) PMO
13 33 (0.77%) SLA
14 24 (0.56%) PCI DSS
15 23 (0.54%) Sarbanes-Oxley
16 19 (0.45%) IFRS 9
17 18 (0.42%) Cyber Essentials PLUS
18 15 (0.35%) IFRS 17
System Software
1 460 (10.79%) Docker
2 148 (3.47%) Active Directory
3 62 (1.45%) VMware Infrastructure
4 38 (0.89%) Firmware
5 29 (0.68%) Hyper-V
6 20 (0.47%) Virtual Machines
7 16 (0.38%) Virtual Desktop
8 14 (0.33%) Embedded Firmware
9 13 (0.31%) XenApp
10 12 (0.28%) Virtual Servers
11 10 (0.23%) vSphere
12 7 (0.16%) VMware Server
13 5 (0.12%) VMware NSX
14 4 (0.094%) HDFS
15 1 (0.023%) Apache Flume
15 1 (0.023%) KVM
15 1 (0.023%) Oracle RAC
15 1 (0.023%) Snort
15 1 (0.023%) VMware ESXi
15 1 (0.023%) XenDesktop
Systems Management
1 393 (9.22%) Kubernetes
2 230 (5.40%) Terraform
3 171 (4.01%) Ansible
4 114 (2.67%) Prometheus
5 111 (2.60%) Grafana
6 39 (0.92%) Microsoft Intune
7 32 (0.75%) Progress Chef
8 23 (0.54%) Puppet
9 16 (0.38%) QRadar
10 15 (0.35%) SCCM
11 11 (0.26%) Nagios
12 7 (0.16%) CA Endevor
12 7 (0.16%) CASB
13 6 (0.14%) Istio
14 5 (0.12%) Argo
14 5 (0.12%) Packer
14 5 (0.12%) Single Sign-On
15 4 (0.094%) Consul
15 4 (0.094%) Graylog
15 4 (0.094%) Kibana
Vendors
1 740 (17.36%) Microsoft
2 252 (5.91%) Cisco
3 164 (3.85%) IBM
4 139 (3.26%) Google
5 103 (2.42%) Databricks
6 102 (2.39%) Oracle
7 90 (2.11%) VMware
8 87 (2.04%) SAP
9 78 (1.83%) Salesforce
10 70 (1.64%) BT
11 61 (1.43%) Red Hat
12 57 (1.34%) ServiceNow
13 33 (0.77%) Adobe
14 27 (0.63%) Dynatrace
14 27 (0.63%) Okta
15 26 (0.61%) Xilinx
16 23 (0.54%) Palo Alto
17 22 (0.52%) Meraki
18 21 (0.49%) Citrix
18 21 (0.49%) Informatica