Electronics Jobs

Electronics
UK

The table below looks at the prevalence of the term Electronics in permanent job vacancies. Included is a benchmarking guide to the salaries offered in vacancies that cited Electronics over the 6 months leading up to 23 October 2024, comparing them to the same period in the previous two years.

6 months to
23 Oct 2024
Same period 2023 Same period 2022
Rank 173 251 262
Rank change year-on-year +78 +11 +70
Permanent jobs citing Electronics 1,171 815 2,090
As % of all permanent jobs advertised in the UK 1.55% 1.37% 1.49%
As % of the General category 2.66% 2.07% 2.18%
Number of salaries quoted 568 521 968
10th Percentile £35,250 £32,000 £33,735
25th Percentile £43,250 £40,000 £41,250
Median annual salary (50th Percentile) £55,000 £52,500 £55,000
Median % change year-on-year +4.76% -4.55% -
75th Percentile £68,750 £66,250 £72,500
90th Percentile £80,000 £77,500 £87,500
UK excluding London median annual salary £55,000 £52,500 £50,000
% change year-on-year +4.76% +5.00% -

All General Skills
UK

Electronics falls under the General Skills category. For comparison with the information above, the following table provides summary statistics for all permanent job vacancies requiring common skills.

Permanent vacancies with a requirement for common skills 44,101 39,349 95,915
As % of all permanent jobs advertised in the UK 58.29% 66.18% 68.25%
Number of salaries quoted 20,105 27,135 50,473
10th Percentile £31,750 £31,250 £32,500
25th Percentile £42,500 £42,500 £44,000
Median annual salary (50th Percentile) £58,033 £60,000 £60,000
Median % change year-on-year -3.28% - +4.35%
75th Percentile £78,750 £80,000 £81,250
90th Percentile £100,000 £100,000 £100,000
UK excluding London median annual salary £50,309 £50,000 £52,500
% change year-on-year +0.62% -4.76% +10.53%

Electronics
Job Vacancy Trend

Job postings citing Electronics as a proportion of all IT jobs advertised.
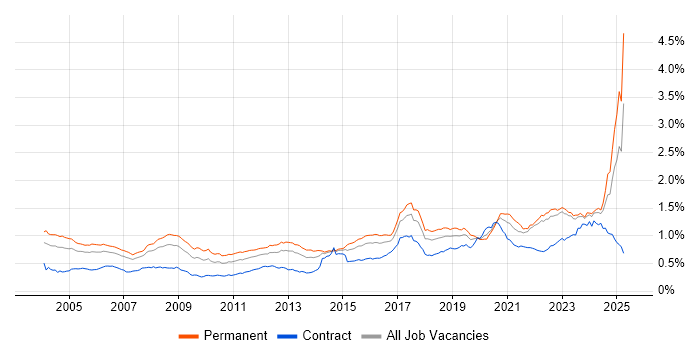
Job vacancy trend for Electronics in the UK

Electronics
Salary Trend

3-month moving average salary quoted in jobs citing Electronics.

Salary trend for Electronics in the UK

Electronics
Salary Histogram

Salary distribution for jobs citing Electronics over the 6 months to 23 October 2024.

Salary histogram for Electronics in the UK

Electronics
Top 17 Job Locations

The table below looks at the demand and provides a guide to the median salaries quoted in IT jobs citing Electronics within the UK over the 6 months to 23 October 2024. The 'Rank Change' column provides an indication of the change in demand within each location based on the same 6 month period last year.

Location Rank Change
on Same Period
Last Year
Matching
Permanent
IT Job Ads
Median Salary
Past 6 Months
Median Salary
% Change
on Same Period
Last Year
Live
Jobs
UK excluding London +69 1,096 £55,000 +4.76% 855
England +58 1,037 £55,000 +4.76% 862
South East +31 341 £50,000 -4.76% 266
Work from Home -46 205 £65,000 +13.04% 742
South West +72 187 £62,500 +25.00% 111
North of England +21 180 £48,750 +2.63% 90
East of England -13 147 £60,000 +9.09% 241
North West +66 131 £47,500 - 38
Midlands -15 115 £47,500 -9.52% 106
Scotland +28 78 £65,000 +26.21% 52
East Midlands +3 59 £42,500 +19.72% 34
London -29 56 £67,500 +3.85% 67
West Midlands -47 56 £70,000 +21.74% 72
Wales +68 38 £60,000 +2.13% 17
Yorkshire -5 30 £55,000 +37.50% 38
North East -33 19 £56,000 +1.82% 14
Northern Ireland +36 10 £35,000 - 10

Electronics
Co-occurring Skills and Capabilities by Category

The follow tables expand on the table above by listing co-occurrences grouped by category. The same employment type, locality and period is covered with up to 20 co-occurrences shown in each of the following categories:

Application Platforms
1 12 (1.02%) CMS
2 11 (0.94%) Confluence
3 9 (0.77%) Apache
3 9 (0.77%) Microsoft Exchange
3 9 (0.77%) SharePoint
4 7 (0.60%) Apache Spark
5 5 (0.43%) Kinematics
6 4 (0.34%) Apache Airflow
7 1 (0.085%) IIS
7 1 (0.085%) WordPress
Applications
1 82 (7.00%) Simulink
2 51 (4.36%) Microsoft Office
3 25 (2.13%) Microsoft Excel
4 10 (0.85%) Microsoft Project
5 9 (0.77%) Microsoft PowerPoint
5 9 (0.77%) Stateflow
6 8 (0.68%) CANalyzer
7 6 (0.51%) OrCAD
8 4 (0.34%) GNU Octave
8 4 (0.34%) InfoPath
9 3 (0.26%) Acrobat
9 3 (0.26%) MadCap Flare
9 3 (0.26%) SOLIDWORKS
10 2 (0.17%) Maple
11 1 (0.085%) Adobe Creative Suite
11 1 (0.085%) EPLAN
11 1 (0.085%) Windchill
Business Applications
1 37 (3.16%) Teamcenter
2 4 (0.34%) Primavera
3 1 (0.085%) Infor M3
3 1 (0.085%) LabWindows
Cloud Services
1 60 (5.12%) AWS
2 43 (3.67%) Azure
3 30 (2.56%) Amazon Kinesis
4 20 (1.71%) SaaS
5 12 (1.02%) Microsoft 365
6 10 (0.85%) GCP
7 9 (0.77%) Azure Data Factory
8 8 (0.68%) GitHub
9 7 (0.60%) Amazon CloudWatch
9 7 (0.60%) Power Platform
10 5 (0.43%) Azure DevOps
10 5 (0.43%) Power Automate
10 5 (0.43%) PowerApps
11 4 (0.34%) OneDrive
12 3 (0.26%) Amazon MSK
12 3 (0.26%) Serverless
13 2 (0.17%) Cloud Computing
13 2 (0.17%) PaaS
14 1 (0.085%) Amazon SQS
14 1 (0.085%) Google Analytics
Communications & Networking
1 39 (3.33%) TCP/IP
2 28 (2.39%) Ethernet
2 28 (2.39%) RS-232
3 20 (1.71%) Wireless
4 18 (1.54%) Bluetooth
5 13 (1.11%) Modbus
5 13 (1.11%) RS-485
6 12 (1.02%) 5G
6 12 (1.02%) DVB
7 11 (0.94%) Network Security
8 10 (0.85%) Firewall
9 9 (0.77%) 4G
10 8 (0.68%) RS-422
11 7 (0.60%) 3G
11 7 (0.60%) HTTP
11 7 (0.60%) Internet
11 7 (0.60%) SD-WAN
11 7 (0.60%) WAN
12 6 (0.51%) MQTT
12 6 (0.51%) Wi-Fi
Database & Business Intelligence
1 35 (2.99%) NoSQL
2 31 (2.65%) PostgreSQL
3 30 (2.56%) DynamoDB
3 30 (2.56%) Redis
4 27 (2.31%) Amazon Aurora
5 8 (0.68%) Big Data
6 7 (0.60%) MySQL
6 7 (0.60%) SQL Server
7 4 (0.34%) Apache Hive
7 4 (0.34%) Data Lake
7 4 (0.34%) Elasticsearch
7 4 (0.34%) Presto
8 3 (0.26%) Amazon RDS
8 3 (0.26%) Data Mining
8 3 (0.26%) Data Warehouse
8 3 (0.26%) Flink
8 3 (0.26%) Relational Database
9 2 (0.17%) Amazon QuickSight
10 1 (0.085%) Electronic Patient Records
10 1 (0.085%) Power BI
Development Applications
1 59 (5.04%) Git
2 54 (4.61%) Rational DOORS
3 36 (3.07%) LabVIEW
4 31 (2.65%) JIRA
5 30 (2.56%) Gatling
6 21 (1.79%) Subversion
7 20 (1.71%) Jenkins
8 16 (1.37%) Rational Rhapsody
9 11 (0.94%) Robot Framework
10 8 (0.68%) Visual Studio
11 6 (0.51%) CANoe
12 5 (0.43%) GitLab
13 4 (0.34%) Eclipse
13 4 (0.34%) Rational Team Concert
14 2 (0.17%) Bitbucket
14 2 (0.17%) TeamCity
15 1 (0.085%) Appium
15 1 (0.085%) Gerrit
15 1 (0.085%) PHPUnit
15 1 (0.085%) SpecFlow
General
1 284 (24.25%) Manufacturing
2 230 (19.64%) Social Skills
3 195 (16.65%) Analytical Skills
4 183 (15.63%) Aerospace
5 127 (10.85%) Finance
6 116 (9.91%) Telecoms
7 111 (9.48%) Marketing
8 99 (8.45%) Automotive
9 95 (8.11%) Public Sector
10 59 (5.04%) Military
11 30 (2.56%) Billing
12 20 (1.71%) Legal
13 17 (1.45%) Law
13 17 (1.45%) Presentation Skills
14 14 (1.20%) Retail
15 12 (1.02%) Inclusion and Diversity
16 9 (0.77%) Avionics
16 9 (0.77%) Organisational Skills
17 7 (0.60%) Banking
17 7 (0.60%) Digital Healthcare
Job Titles
1 297 (25.36%) Software Engineer
2 274 (23.40%) Senior
3 201 (17.16%) Embedded Engineer
4 137 (11.70%) Electronics Engineer
5 136 (11.61%) Embedded Software Engineer
6 103 (8.80%) Systems Engineer
7 96 (8.20%) Senior Electrical Engineer
8 87 (7.43%) Hardware Engineer
9 74 (6.32%) Design Engineer
10 59 (5.04%) Lead
11 56 (4.78%) Principal Engineer
11 56 (4.78%) Senior Embedded Engineer
12 52 (4.44%) Electronics Design Engineer
13 49 (4.18%) Developer
14 46 (3.93%) Senior Software Engineer
15 41 (3.50%) Senior Electronics Engineer
16 40 (3.42%) Graduate
17 39 (3.33%) Junior
18 38 (3.25%) Senior Embedded Software Engineer
19 34 (2.90%) Applications Engineer
Libraries, Frameworks & Software Standards
1 39 (3.33%) REST
2 37 (3.16%) .NET
3 32 (2.73%) Web Services
4 31 (2.65%) GraphQL
4 31 (2.65%) http4s
5 27 (2.31%) Scalaz
6 21 (1.79%) Lambda Expressions
7 19 (1.62%) HTML
8 13 (1.11%) Boost C++ Libraries
8 13 (1.11%) JSON
8 13 (1.11%) XML
9 11 (0.94%) .NET Framework
10 8 (0.68%) Yocto
11 7 (0.60%) WPF
12 6 (0.51%) .NET Core
12 6 (0.51%) COM
13 5 (0.43%) AngularJS
13 5 (0.43%) CSS
13 5 (0.43%) pytest
13 5 (0.43%) STL
Miscellaneous
1 86 (7.34%) FPGA
2 73 (6.23%) Embedded Systems
3 55 (4.70%) Algorithms
4 48 (4.10%) VHDL
5 44 (3.76%) IoT
6 43 (3.67%) Self-Motivation
7 42 (3.59%) Analogue Electronics
8 32 (2.73%) Robotics
9 31 (2.65%) Blog
10 30 (2.56%) Media Streaming
11 28 (2.39%) Management Information System
12 19 (1.62%) CAN bus
13 18 (1.54%) Distributed Systems
14 16 (1.37%) Analytical Mindset
14 16 (1.37%) Linux Command Line
15 14 (1.20%) Optoelectronics
16 13 (1.11%) Greenfield Project
17 11 (0.94%) CCTV
17 11 (0.94%) Renewable Energy
17 11 (0.94%) Virtual Team
Operating Systems
1 183 (15.63%) Linux
2 95 (8.11%) Windows
3 59 (5.04%) Embedded Linux
4 22 (1.88%) VxWorks
5 18 (1.54%) Android
6 16 (1.37%) FreeRTOS
7 15 (1.28%) Windows Server
8 13 (1.11%) Unix
9 10 (0.85%) VMS
10 7 (0.60%) Apple iOS
10 7 (0.60%) Debian
11 5 (0.43%) Ubuntu
12 4 (0.34%) Mac OS
12 4 (0.34%) Windows 10
13 2 (0.17%) Windows Embedded Compact
14 1 (0.085%) Alpine Linux
14 1 (0.085%) Windows Server 2019
Processes & Methodologies
1 353 (30.15%) Software Engineering
2 253 (21.61%) Problem-Solving
3 185 (15.80%) Computer Science
4 144 (12.30%) Decision-Making
5 143 (12.21%) Agile
6 125 (10.67%) Systems Engineering
7 111 (9.48%) Physics
8 97 (8.28%) Business Intelligence
8 97 (8.28%) Project Management
9 96 (8.20%) Digital Marketing
9 96 (8.20%) Programme Management
10 84 (7.17%) Mathematics
11 81 (6.92%) Software Testing
12 75 (6.40%) Continuous Improvement
13 69 (5.89%) Validation
14 66 (5.64%) UML
14 66 (5.64%) Unit Testing
15 63 (5.38%) Mentoring
16 62 (5.29%) Schematic Capture
17 57 (4.87%) DevOps
Programming Languages
1 293 (25.02%) C
2 280 (23.91%) C++
3 189 (16.14%) Python
4 117 (9.99%) MATLAB
5 101 (8.63%) Java
6 93 (7.94%) C#
7 84 (7.17%) Embedded C
8 41 (3.50%) SQL
9 36 (3.07%) Embedded C++
10 35 (2.99%) Scala
11 30 (2.56%) JavaScript
12 13 (1.11%) Go
12 13 (1.11%) Kotlin
12 13 (1.11%) R
13 10 (0.85%) PHP
13 10 (0.85%) PowerShell
14 9 (0.77%) Rust
15 7 (0.60%) Perl
16 6 (0.51%) VB
17 5 (0.43%) Ada
Qualifications
1 516 (44.06%) Degree
2 115 (9.82%) Master's Degree
3 109 (9.31%) Security Cleared
4 59 (5.04%) Computer Science Degree
5 30 (2.56%) SC Cleared
6 27 (2.31%) DV Cleared
7 19 (1.62%) PhD
8 13 (1.11%) HND
9 9 (0.77%) TOGAF Certification
10 8 (0.68%) Numerate Degree
11 7 (0.60%) Six Sigma Black Belt
11 7 (0.60%) Six Sigma Green Belt
12 6 (0.51%) Network+ Certification
12 6 (0.51%) PMI Certification
13 5 (0.43%) Chartered Engineer
14 3 (0.26%) HNC
14 3 (0.26%) Microsoft Certification
15 2 (0.17%) Cisco Certification
15 2 (0.17%) CISSP
15 2 (0.17%) MCSE
Quality Assurance & Compliance
1 40 (3.42%) QA
2 28 (2.39%) ISO 26262
3 17 (1.45%) AUTOSAR
4 15 (1.28%) MISRA
5 10 (0.85%) ISO/IEC 27001
6 9 (0.77%) JTAG
7 8 (0.68%) IEC 62304
8 7 (0.60%) ISO 13485
8 7 (0.60%) ISO/IEC 27002 (supersedes ISO/IEC 17799)
8 7 (0.60%) ISO/IEC 27005
8 7 (0.60%) MISRA C
9 6 (0.51%) ISO 9001
10 5 (0.43%) Automotive SPICE
10 5 (0.43%) Cyber Essentials
10 5 (0.43%) NIST
10 5 (0.43%) NIST 800
10 5 (0.43%) SLA
11 4 (0.34%) NCSC
12 2 (0.17%) PCI DSS
12 2 (0.17%) PMO
System Software
1 220 (18.79%) Firmware
2 85 (7.26%) Embedded Firmware
3 16 (1.37%) Docker
4 14 (1.20%) Virtual Machines
5 7 (0.60%) Hyper-V
5 7 (0.60%) VMware Infrastructure
6 3 (0.26%) Active Directory
6 3 (0.26%) Slurm Workload Manager
7 2 (0.17%) Microsoft Virtual Server
7 2 (0.17%) Virtual Servers
7 2 (0.17%) vSphere
8 1 (0.085%) VMware ESXi
Systems Management
1 14 (1.20%) Kubernetes
2 9 (0.77%) Terraform
3 7 (0.60%) Nagios
4 4 (0.34%) Functional Safety
5 1 (0.085%) SCCM
5 1 (0.085%) vCenter Server
5 1 (0.085%) vRealize
Vendors
1 98 (8.37%) SAP
2 75 (6.40%) Microsoft
3 47 (4.01%) EMC
4 39 (3.33%) IBM
5 14 (1.20%) Wind River
6 10 (0.85%) Databricks
7 8 (0.68%) Google
7 8 (0.68%) Salesforce
8 7 (0.60%) VMware
9 5 (0.43%) Atlassian
9 5 (0.43%) SYSPRO
9 5 (0.43%) Xilinx
10 4 (0.34%) Adobe
10 4 (0.34%) Intel
10 4 (0.34%) Workday
10 4 (0.34%) Xamarin
11 3 (0.26%) Atmel
11 3 (0.26%) Freescale
11 3 (0.26%) Siemens
12 2 (0.17%) Rockwell