Accessibility Jobs

Accessibility (a11y)
UK

The table below provides summary statistics for permanent job vacancies requiring Accessibility skills. It includes a benchmarking guide to the annual salaries offered in vacancies that cited Accessibility over the 6 months leading up to 7 July 2025, comparing them to the same period in the previous two years.

6 months to
7 Jul 2025
Same period 2024 Same period 2023
Rank 197 279 364
Rank change year-on-year +82 +85 -136
Permanent jobs citing Accessibility 933 1,037 797
As % of all permanent jobs advertised in the UK 1.56% 0.98% 0.90%
As % of the Quality Assurance & Compliance category 10.12% 7.59% 5.61%
Number of salaries quoted 357 611 472
10th Percentile £33,750 £31,250 £37,500
25th Percentile £45,750 £39,000 £42,739
Median annual salary (50th Percentile) £57,500 £52,500 £55,000
Median % change year-on-year +9.52% -4.55% -
75th Percentile £73,750 £65,750 £70,000
90th Percentile £88,750 £85,000 £84,063
UK excluding London median annual salary £55,000 £50,000 £53,500
% change year-on-year +10.00% -6.54% +13.29%

All Quality Assurance and Compliance Skills
UK

Accessibility falls under the Quality Assurance and Compliance category. For comparison with the information above, the following table provides summary statistics for all permanent job vacancies requiring quality assurance or compliance skills.

Permanent vacancies with a requirement for quality assurance or compliance skills 9,221 13,655 14,201
As % of all permanent jobs advertised in the UK 15.43% 12.85% 16.02%
Number of salaries quoted 4,860 9,056 8,292
10th Percentile £30,580 £26,500 £32,500
25th Percentile £42,500 £36,258 £42,500
Median annual salary (50th Percentile) £60,000 £52,500 £57,500
Median % change year-on-year +14.29% -8.70% +4.55%
75th Percentile £73,750 £71,250 £76,250
90th Percentile £90,000 £92,500 £92,500
UK excluding London median annual salary £55,000 £47,500 £50,000
% change year-on-year +15.79% -5.00% -

Accessibility
Job Vacancy Trend

Job postings citing Accessibility as a proportion of all IT jobs advertised.
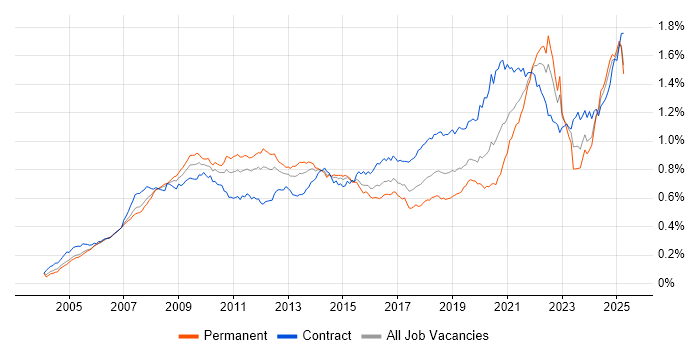
Job vacancy trend for Accessibility in the UK

Accessibility
Salary Trend

3-month moving average salary quoted in jobs citing Accessibility.

Salary trend for Accessibility in the UK

Accessibility
Salary Histogram

Salary distribution for jobs citing Accessibility over the 6 months to 7 July 2025.

Salary histogram for Accessibility in the UK

Accessibility
Top 18 Job Locations

The table below looks at the demand and provides a guide to the median salaries quoted in IT jobs citing Accessibility within the UK over the 6 months to 7 July 2025. The 'Rank Change' column provides an indication of the change in demand within each location based on the same 6 month period last year.

Location Rank Change
on Same Period
Last Year
Matching
Permanent
IT Job Ads
Median Salary
Past 6 Months
Median Salary
% Change
on Same Period
Last Year
Live
Jobs
England +76 710 £56,750 +3.18% 1,016
UK excluding London +50 531 £55,000 +10.00% 558
Work from Home +115 494 £57,500 - 647
London +135 292 £62,500 -0.97% 549
North of England +4 159 £50,500 -12.88% 129
South East +87 134 £50,000 +25.00% 130
North West -3 130 £47,500 -9.52% 73
Scotland +107 123 £72,500 +27.42% 30
Midlands 0 53 £55,000 -5.11% 61
South West +83 38 £69,018 +41.57% 63
West Midlands -3 30 £52,500 -14.29% 40
East Midlands +39 23 £55,000 +46.67% 21
Yorkshire +2 18 £58,750 +6.37% 43
Wales +28 12 £55,000 +3.77% 20
North East +22 11 - - 14
East of England +5 9 £54,721 +48.67% 92
Isle of Man - 4 - -
Northern Ireland +27 1 £85,000 +44.56% 41

Accessibility
Co-occurring Skills and Capabilities by Category

The follow tables expand on the table above by listing co-occurrences grouped by category. The same employment type, locality and period is covered with up to 20 co-occurrences shown in each of the following categories:

Application Platforms
1 86 (9.22%) CMS
2 36 (3.86%) WordPress
3 25 (2.68%) Umbraco
4 12 (1.29%) SharePoint
5 11 (1.18%) Confluence
6 10 (1.07%) Headless CMS
7 9 (0.96%) Apache
8 7 (0.75%) Apache Spark
9 6 (0.64%) Apache Airflow
9 6 (0.64%) Drupal
10 5 (0.54%) nginx
11 4 (0.43%) Adobe Experience Manager
11 4 (0.43%) IIS
12 3 (0.32%) GemFire
12 3 (0.32%) Moodle
13 2 (0.21%) ArcGIS
13 2 (0.21%) ColdFusion
13 2 (0.21%) IBM Domino
13 2 (0.21%) Jadu
14 1 (0.11%) Microsoft Exchange
Applications
1 25 (2.68%) Adobe XD
2 16 (1.71%) Sketch
3 15 (1.61%) Adobe Creative Suite
4 14 (1.50%) Photoshop
5 13 (1.39%) Microsoft Excel
5 13 (1.39%) Microsoft Office
6 9 (0.96%) Adobe Premiere
7 8 (0.86%) Adobe Illustrator
7 8 (0.86%) AutoCAD
8 6 (0.64%) Adobe After Effects
8 6 (0.64%) InVision
9 5 (0.54%) Microsoft PowerPoint
9 5 (0.54%) Microsoft Project
10 4 (0.43%) Revit
11 3 (0.32%) MS Visio
11 3 (0.32%) Spreadsheet
12 2 (0.21%) InDesign
12 2 (0.21%) Trello
13 1 (0.11%) ProjectWise
13 1 (0.11%) Zeplin
Business Applications
1 11 (1.18%) JDE OneWorld
1 11 (1.18%) NetSuite
2 9 (0.96%) Shopify
3 4 (0.43%) Dynamics CRM
4 3 (0.32%) Oracle Applications
4 3 (0.32%) Oracle EBS
4 3 (0.32%) Primavera
4 3 (0.32%) Sparx Enterprise Architect
5 2 (0.21%) SAP Oil and Gas
6 1 (0.11%) Oracle BPM
6 1 (0.11%) Raiser’s Edge
6 1 (0.11%) Salesforce CRM
6 1 (0.11%) SAP S/4HANA
6 1 (0.11%) Siebel CRM
Cloud Services
1 191 (20.47%) Azure
2 189 (20.26%) AWS
3 66 (7.07%) Figma
3 66 (7.07%) Power Platform
4 40 (4.29%) Google Analytics
5 39 (4.18%) GCP
6 33 (3.54%) SaaS
7 30 (3.22%) Snowflake
8 20 (2.14%) Microsoft Purview
9 17 (1.82%) Dynamics 365
10 16 (1.71%) Azure DevOps
10 16 (1.71%) PowerApps
11 15 (1.61%) Collibra
11 15 (1.61%) Serverless
12 14 (1.50%) Amazon S3
12 14 (1.50%) Boomi
12 14 (1.50%) Canva
13 13 (1.39%) GitHub
14 12 (1.29%) Amazon SQS
15 11 (1.18%) Microsoft 365
Communications & Networking
1 19 (2.04%) Intranet
2 17 (1.82%) Firewall
3 15 (1.61%) VPN
4 13 (1.39%) Network Security
5 10 (1.07%) DNS
6 5 (0.54%) DHCP
7 4 (0.43%) LoRaWAN
8 3 (0.32%) Cisco IOS
8 3 (0.32%) HTTP
8 3 (0.32%) IP Telephony
8 3 (0.32%) IPsec
8 3 (0.32%) LAN
8 3 (0.32%) MPLS
8 3 (0.32%) TCP/IP
8 3 (0.32%) VLAN
8 3 (0.32%) WAN
8 3 (0.32%) Wireless
8 3 (0.32%) Wireless Security
8 3 (0.32%) Wireshark
8 3 (0.32%) WLAN
Database & Business Intelligence
1 125 (13.40%) SQL Server
2 52 (5.57%) Data Warehouse
3 51 (5.47%) Power BI
4 46 (4.93%) Metadata
5 32 (3.43%) NoSQL
6 31 (3.32%) Data Lake
7 23 (2.47%) Tableau
8 16 (1.71%) Relational Database
9 14 (1.50%) MongoDB
10 12 (1.29%) MySQL
11 9 (0.96%) IBM InfoSphere
11 9 (0.96%) PostgreSQL
12 8 (0.86%) BigQuery
13 7 (0.75%) Hadoop
13 7 (0.75%) Redis
14 6 (0.64%) Big Data
14 6 (0.64%) GIS
15 5 (0.54%) Data Vault
16 4 (0.43%) Apache Iceberg
16 4 (0.43%) Delta Lake
Development Applications
1 118 (12.65%) JIRA
2 102 (10.93%) Bitbucket
3 100 (10.72%) Selenium
4 97 (10.40%) GitLab
5 90 (9.65%) Cucumber
5 90 (9.65%) Maven
5 90 (9.65%) SonarQube
5 90 (9.65%) Sonatype Nexus
6 52 (5.57%) Git
7 19 (2.04%) Axure RP
8 15 (1.61%) webpack
9 12 (1.29%) Balsamiq
9 12 (1.29%) Cypress.io
9 12 (1.29%) Vite
10 9 (0.96%) Jenkins
11 8 (0.86%) Babel
12 6 (0.64%) Storybook
13 5 (0.54%) NUnit
13 5 (0.54%) Xcode
14 4 (0.43%) JUnit
General
1 423 (45.34%) Finance
2 243 (26.05%) Social Skills
3 214 (22.94%) Banking
4 195 (20.90%) Inclusion and Diversity
5 132 (14.15%) Retail
6 113 (12.11%) Law
6 113 (12.11%) Marketing
7 102 (10.93%) Analytical Skills
8 91 (9.75%) Investment Banking
9 90 (9.65%) Corporate Banking
10 75 (8.04%) Public Sector
11 71 (7.61%) Legal
12 35 (3.75%) Local Government
13 26 (2.79%) Advertising
14 19 (2.04%) Manufacturing
15 18 (1.93%) Tech for Good
16 17 (1.82%) Influencing Skills
17 16 (1.71%) Presentation Skills
18 14 (1.50%) Organisational Skills
18 14 (1.50%) Publishing
Job Titles
1 233 (24.97%) Senior
2 150 (16.08%) Developer
3 138 (14.79%) Designer
4 135 (14.47%) Software Engineer
5 99 (10.61%) Lead
6 97 (10.40%) UX Designer
7 89 (9.54%) Senior Designer
8 84 (9.00%) Senior UX Designer
9 58 (6.22%) Analyst
10 44 (4.72%) Senior Developer
11 38 (4.07%) Front-End Developer (Client-Side Developer)
12 29 (3.11%) Infrastructure Engineer
13 28 (3.00%) UX Developer
14 26 (2.79%) Civil Engineer
15 25 (2.68%) Development Engineer
16 23 (2.47%) Security Engineer
17 20 (2.14%) Full-Stack Developer
18 19 (2.04%) Front-End Engineer (Client-Side Engineer)
18 19 (2.04%) Principal Engineer
18 19 (2.04%) Senior Manager
Libraries, Frameworks & Software Standards
1 252 (27.01%) CSS
2 241 (25.83%) HTML
3 171 (18.33%) React
4 136 (14.58%) HTML5
5 130 (13.93%) REST
6 129 (13.83%) CSS3
7 119 (12.75%) RESTful
8 104 (11.15%) Jest
8 104 (11.15%) Sass
9 99 (10.61%) Kafka
9 99 (10.61%) Spring
10 96 (10.29%) Redux
11 93 (9.97%) Spring Boot
12 90 (9.65%) JPA
13 38 (4.07%) jQuery
14 36 (3.86%) .NET
15 28 (3.00%) Node.js
16 25 (2.68%) JSON
17 22 (2.36%) Next.js
18 21 (2.25%) GraphQL
Miscellaneous
1 126 (13.50%) Product Ownership
2 95 (10.18%) Enterprise Software
3 44 (4.72%) NHS
4 32 (3.43%) Social Media
5 29 (3.11%) Management Information System
6 26 (2.79%) Self-Motivation
7 24 (2.57%) Mobile App
8 19 (2.04%) Cloud Native
9 16 (1.71%) FMCG
10 14 (1.50%) Derivative
10 14 (1.50%) Driving Licence
10 14 (1.50%) Onboarding
11 13 (1.39%) Greenfield Project
12 12 (1.29%) Algorithms
12 12 (1.29%) Data Structures
13 10 (1.07%) Video Editing
13 10 (1.07%) Virtual Team
14 9 (0.96%) Analytical Mindset
14 9 (0.96%) Renewable Energy
15 8 (0.86%) Fixed Income
Operating Systems
1 25 (2.68%) Apple iOS
2 24 (2.57%) Android
3 12 (1.29%) Windows
4 10 (1.07%) Linux
4 10 (1.07%) Unix
5 2 (0.21%) VMS
5 2 (0.21%) Windows 10
5 2 (0.21%) Windows Server
5 2 (0.21%) Windows Vista
Processes & Methodologies
1 423 (45.34%) Agile
2 368 (39.44%) User Experience
3 219 (23.47%) Mentoring
4 196 (21.01%) Stakeholder Management
5 188 (20.15%) Project Management
5 188 (20.15%) UX Design
6 181 (19.40%) User Research
7 169 (18.11%) Analytics
8 167 (17.90%) User-Centered Design (UCD)
9 164 (17.58%) Problem-Solving
10 159 (17.04%) Software Engineering
11 154 (16.51%) Front End Development
12 152 (16.29%) CI/CD
13 147 (15.76%) DevOps
14 142 (15.22%) Usability Testing
15 140 (15.01%) Prototyping
15 140 (15.01%) Wireframes
16 132 (14.15%) Responsive Web Design
17 129 (13.83%) Test Automation
18 125 (13.40%) Full-Stack Development
Programming Languages
1 247 (26.47%) JavaScript
2 210 (22.51%) SQL
3 157 (16.83%) TypeScript
4 114 (12.22%) Java
5 82 (8.79%) Python
6 36 (3.86%) C#
7 23 (2.47%) PHP
8 13 (1.39%) R
9 10 (1.07%) PowerShell
9 10 (1.07%) Swift
10 9 (0.96%) Go
11 7 (0.75%) Perl
12 4 (0.43%) Ruby
12 4 (0.43%) Scala
12 4 (0.43%) T-SQL
13 3 (0.32%) Apex Code
13 3 (0.32%) Elixir
13 3 (0.32%) Objective-C
13 3 (0.32%) PL/SQL
13 3 (0.32%) Shell Script
Qualifications
1 169 (18.11%) Degree
2 58 (6.22%) Security Cleared
3 35 (3.75%) SC Cleared
4 22 (2.36%) CISSP
5 17 (1.82%) Computer Science Degree
5 17 (1.82%) DBS Check
5 17 (1.82%) Master's Degree
6 15 (1.61%) Postgraduate
7 14 (1.50%) CISM
8 13 (1.39%) BPSS Clearance
9 9 (0.96%) ACCA
10 8 (0.86%) Microsoft Certification
11 7 (0.75%) CIMA
11 7 (0.75%) DV Cleared
11 7 (0.75%) HNC
12 6 (0.64%) Cisco Certification
12 6 (0.64%) HND
13 4 (0.43%) Chartered Engineer
13 4 (0.43%) CREST Certified
13 4 (0.43%) SANS
Quality Assurance & Compliance
1 147 (15.76%) QA
2 82 (8.79%) WCAG
3 80 (8.57%) Data Quality
4 61 (6.54%) GDPR
5 24 (2.57%) NIST
6 12 (1.29%) NCSC
7 8 (0.86%) Actionable Recommendations
7 8 (0.86%) PMO
8 7 (0.75%) SLA
9 5 (0.54%) GAAP
9 5 (0.54%) IFRS
10 4 (0.43%) California Consumer Privacy Act
11 3 (0.32%) ISO/IEC 27001
12 2 (0.21%) WAI
13 1 (0.11%) Cyber Essentials
13 1 (0.11%) HIPAA
13 1 (0.11%) MiFID
13 1 (0.11%) PERC
13 1 (0.11%) Section 508
System Software
1 107 (11.47%) Docker
2 6 (0.64%) HDFS
3 4 (0.43%) Active Directory
4 3 (0.32%) Virtual Machines
5 1 (0.11%) VMware Infrastructure
Systems Management
1 107 (11.47%) Kubernetes
2 3 (0.32%) Oracle RMAN
3 2 (0.21%) Ansible
3 2 (0.21%) Hadoop YARN
3 2 (0.21%) Terraform
4 1 (0.11%) AppManager
4 1 (0.11%) Microsoft Intune
4 1 (0.11%) QRadar
Vendors
1 93 (9.97%) Solace
2 92 (9.86%) Microsoft
3 73 (7.82%) Adobe
4 53 (5.68%) Google
5 23 (2.47%) Salesforce
6 16 (1.71%) Informatica
7 12 (1.29%) HP
7 12 (1.29%) SAP
7 12 (1.29%) ServiceNow
8 11 (1.18%) Apple
8 11 (1.18%) Dell
9 10 (1.07%) Cisco
9 10 (1.07%) IBM
9 10 (1.07%) Mercator
9 10 (1.07%) Oracle
10 8 (0.86%) Instagram
11 7 (0.75%) Facebook
11 7 (0.75%) YouTube
12 6 (0.64%) TOWER Software
13 5 (0.54%) Autodesk