Advertising Jobs

Advertising
UK

The table below looks at the prevalence of the term Advertising in permanent job vacancies. Included is a benchmarking guide to the salaries offered in vacancies that cited Advertising over the 6 months leading up to 15 May 2025, comparing them to the same period in the previous two years.

6 months to
15 May 2025
Same period 2024 Same period 2023
Rank 248 293 425
Rank change year-on-year +45 +132 -221
Permanent jobs citing Advertising 682 977 720
As % of all permanent jobs advertised in the UK 1.24% 0.99% 0.72%
As % of the General category 1.78% 1.65% 1.05%
Number of salaries quoted 340 667 583
10th Percentile £30,000 £23,650 £27,000
25th Percentile £41,188 £32,500 £38,500
Median annual salary (50th Percentile) £55,000 £47,500 £52,500
Median % change year-on-year +15.79% -9.52% -4.55%
75th Percentile £70,000 £67,500 £71,250
90th Percentile £98,750 £81,250 £90,000
UK excluding London median annual salary £48,000 £42,500 £45,000
% change year-on-year +12.94% -5.56% -

All General Skills
UK

Advertising falls under the General Skills category. For comparison with the information above, the following table provides summary statistics for all permanent job vacancies requiring common skills.

Permanent vacancies with a requirement for common skills 38,398 59,267 68,463
As % of all permanent jobs advertised in the UK 69.61% 59.84% 68.23%
Number of salaries quoted 18,378 39,596 36,975
10th Percentile £27,000 £27,500 £32,500
25th Percentile £40,000 £36,250 £43,162
Median annual salary (50th Percentile) £55,000 £52,500 £60,000
Median % change year-on-year +4.76% -12.50% -
75th Percentile £75,000 £72,500 £82,000
90th Percentile £100,000 £92,500 £102,500
UK excluding London median annual salary £50,000 £47,500 £52,500
% change year-on-year +5.26% -9.52% +5.00%

Advertising
Job Vacancy Trend

Job postings citing Advertising as a proportion of all IT jobs advertised.
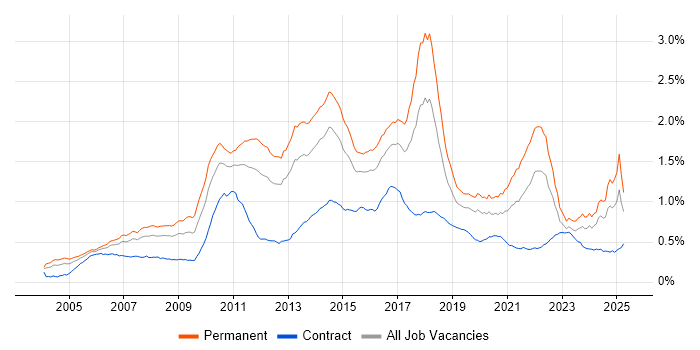
Job vacancy trend for Advertising in the UK

Advertising
Salary Trend

3-month moving average salary quoted in jobs citing Advertising.

Salary trend for Advertising in the UK

Advertising
Salary Histogram

Salary distribution for jobs citing Advertising over the 6 months to 15 May 2025.

Salary histogram for Advertising in the UK

Advertising
Top 17 Job Locations

The table below looks at the demand and provides a guide to the median salaries quoted in IT jobs citing Advertising within the UK over the 6 months to 15 May 2025. The 'Rank Change' column provides an indication of the change in demand within each location based on the same 6 month period last year.

Location Rank Change
on Same Period
Last Year
Matching
Permanent
IT Job Ads
Median Salary
Past 6 Months
Median Salary
% Change
on Same Period
Last Year
Live
Jobs
England -7 594 £55,000 +15.79% 1,380
UK excluding London +28 306 £48,000 +12.94% 666
London +32 299 £63,750 -1.92% 884
Work from Home -7 294 £53,750 +11.40% 786
South East +15 114 £51,500 +5.10% 203
North of England +1 63 £47,250 +11.18% 184
East of England +61 47 £44,000 +1.15% 59
Midlands +43 44 £56,250 +40.63% 90
West Midlands +59 40 £57,500 +43.75% 48
North West -67 23 £25,000 -41.18% 101
North East +51 21 £56,500 +32.94% 38
Yorkshire +66 19 £40,000 +23.08% 49
South West +54 19 £41,500 +18.57% 92
Scotland +114 13 £57,500 +76.92% 29
Northern Ireland - 4 £62,000 - 14
East Midlands +12 3 £40,000 +14.29% 36
Wales +29 2 - - 19

Advertising
Co-occurring Skills and Capabilities by Category

The follow tables expand on the table above by listing co-occurrences grouped by category. The same employment type, locality and period is covered with up to 20 co-occurrences shown in each of the following categories:

Application Platforms
1 29 (4.25%) CMS
2 23 (3.37%) Apache Spark
3 15 (2.20%) Microsoft Exchange
4 9 (1.32%) Drupal
4 9 (1.32%) WordPress
5 8 (1.17%) Confluence
6 7 (1.03%) Sitecore CMS
7 6 (0.88%) IIS
8 5 (0.73%) SAS
8 5 (0.73%) SharePoint
8 5 (0.73%) WinCC
9 4 (0.59%) Exchange Server 2013
9 4 (0.59%) Headless CMS
9 4 (0.59%) Skype for Business
10 3 (0.44%) Apache
10 3 (0.44%) Blackberry Enterprise Server
11 2 (0.29%) Apache Airflow
12 1 (0.15%) Moodle
12 1 (0.15%) Office Communications Server
12 1 (0.15%) SharePoint 2010
Applications
1 44 (6.45%) Microsoft Excel
2 29 (4.25%) Photoshop
3 16 (2.35%) Microsoft Office
4 12 (1.76%) Microsoft PowerPoint
5 8 (1.17%) Adobe Creative Suite
5 8 (1.17%) Adobe Illustrator
6 6 (0.88%) Adobe Premiere
7 5 (0.73%) Adobe After Effects
7 5 (0.73%) SPSS
8 4 (0.59%) InDesign
8 4 (0.59%) Notion
8 4 (0.59%) Simulink
9 3 (0.44%) ProjectWise
10 2 (0.29%) MS Visio
10 2 (0.29%) Spreadsheet
11 1 (0.15%) 3ds Max
11 1 (0.15%) AutoCAD
11 1 (0.15%) CINEMA 4D
11 1 (0.15%) Microsoft Project
11 1 (0.15%) Trello
Business Applications
1 16 (2.35%) Dynamics CRM
2 15 (2.20%) Shopify
3 5 (0.73%) CiviCRM
4 4 (0.59%) Magento
4 4 (0.59%) NetSuite
5 1 (0.15%) Infor M3
5 1 (0.15%) Raiser’s Edge
Cloud Services
1 91 (13.34%) Google Analytics
2 76 (11.14%) Google Ads
3 57 (8.36%) Azure
4 36 (5.28%) AWS
4 36 (5.28%) Facebook Ads
5 30 (4.40%) Power Platform
6 19 (2.79%) Canva
6 19 (2.79%) SaaS
7 16 (2.35%) Google Sheets
7 16 (2.35%) Microsoft 365
8 15 (2.20%) MailChimp
9 13 (1.91%) Azure DevOps
9 13 (1.91%) GCP
10 12 (1.76%) Microsoft Advertising
11 10 (1.47%) Adobe Creative Cloud
11 10 (1.47%) Serverless
12 8 (1.17%) Amazon S3
12 8 (1.17%) AWS Lambda
13 7 (1.03%) AWS CloudFormation
14 6 (0.88%) PaaS
Communications & Networking
1 20 (2.93%) HTTP
2 13 (1.91%) WAN
3 10 (1.47%) Internet
4 9 (1.32%) SAN
5 7 (1.03%) BGP
6 6 (0.88%) Firewall
7 5 (0.73%) EIGRP
7 5 (0.73%) Ethernet
7 5 (0.73%) OSPF
7 5 (0.73%) Profibus
7 5 (0.73%) SD-WAN
8 4 (0.59%) ADSL
8 4 (0.59%) Network Security
9 3 (0.44%) FTP
9 3 (0.44%) IMAP
9 3 (0.44%) Skype
9 3 (0.44%) SMTP
10 2 (0.29%) Junos
10 2 (0.29%) MPLS
10 2 (0.29%) MQTT
Database & Business Intelligence
1 57 (8.36%) Big Data
2 28 (4.11%) Power BI
3 26 (3.81%) SQL Server
4 13 (1.91%) GIS
5 11 (1.61%) Tableau
6 10 (1.47%) Data Lake
7 9 (1.32%) BigQuery
7 9 (1.32%) Hadoop
7 9 (1.32%) Looker
7 9 (1.32%) PostgreSQL
8 8 (1.17%) Azure SQL Database
8 8 (1.17%) MongoDB
8 8 (1.17%) MySQL
9 6 (0.88%) Apache Hive
9 6 (0.88%) NoSQL
10 5 (0.73%) Amazon Athena
10 5 (0.73%) Amazon Redshift
10 5 (0.73%) Data Warehouse
10 5 (0.73%) DB2
10 5 (0.73%) DynamoDB
Development Applications
1 19 (2.79%) Git
1 19 (2.79%) JIRA
2 4 (0.59%) Jenkins
3 2 (0.29%) ER Studio
3 2 (0.29%) ERwin
3 2 (0.29%) GitLab
3 2 (0.29%) MSI
3 2 (0.29%) PowerDesigner
3 2 (0.29%) TeamCity
4 1 (0.15%) Artifactory
4 1 (0.15%) Bitbucket
4 1 (0.15%) Browser DevTools
4 1 (0.15%) LabVIEW
4 1 (0.15%) Liquibase
4 1 (0.15%) MagicDraw
4 1 (0.15%) Octopus Deploy
4 1 (0.15%) PHPUnit
4 1 (0.15%) Selenium
4 1 (0.15%) SonarQube
4 1 (0.15%) Visual Studio
General
1 353 (51.76%) Marketing
2 261 (38.27%) Social Skills
3 175 (25.66%) Analytical Skills
4 152 (22.29%) Finance
5 66 (9.68%) Inclusion and Diversity
6 53 (7.77%) Retail
7 34 (4.99%) Electronics
8 33 (4.84%) Games
9 30 (4.40%) Legal
10 26 (3.81%) Presentation Skills
11 22 (3.23%) Law
12 20 (2.93%) Organisational Skills
13 19 (2.79%) Brand Awareness
14 18 (2.64%) Manufacturing
15 16 (2.35%) Banking
16 14 (2.05%) Telecoms
17 13 (1.91%) Publishing
18 9 (1.32%) Public Sector
19 8 (1.17%) Police
20 7 (1.03%) Multimedia
Job Titles
1 115 (16.86%) Senior
2 100 (14.66%) Account Manager
3 65 (9.53%) Senior Manager
4 55 (8.06%) Senior Account Manager
5 49 (7.18%) Developer
6 39 (5.72%) Analyst
7 36 (5.28%) Software Engineer
8 34 (4.99%) Strategic Account Manager
9 31 (4.55%) Lead
10 23 (3.37%) Senior Software Engineer
11 21 (3.08%) Architect
11 21 (3.08%) Marketing Manager
12 20 (2.93%) Sales Manager
13 16 (2.35%) PPC Specialist
13 16 (2.35%) Support Engineer
14 15 (2.20%) SEO Specialist
15 14 (2.05%) Data Engineer
15 14 (2.05%) Head of Content
15 14 (2.05%) Head of Production
15 14 (2.05%) IT Manager
Libraries, Frameworks & Software Standards
1 33 (4.84%) React
2 28 (4.11%) HTML
3 22 (3.23%) Kafka
4 17 (2.49%) .NET
5 16 (2.35%) CSS
6 13 (1.91%) Next.js
6 13 (1.91%) RESTful
7 12 (1.76%) HTML5
8 11 (1.61%) REST
9 10 (1.47%) Django
10 9 (1.32%) AngularJS
10 9 (1.32%) ASP.NET
11 8 (1.17%) ASP.NET MVC
12 7 (1.03%) ASP.NET Web API
12 7 (1.03%) Node.js
12 7 (1.03%) Redux
13 6 (0.88%) .NET Core
13 6 (0.88%) CSS3
13 6 (0.88%) JWT
13 6 (0.88%) Web Services
Miscellaneous
1 118 (17.30%) Digital Media
2 111 (16.28%) Social Media
3 87 (12.76%) Marketing Technology
4 65 (9.53%) Self-Motivation
5 40 (5.87%) Product Ownership
6 27 (3.96%) Blog
7 25 (3.67%) Distributed Systems
8 18 (2.64%) Analytical Mindset
9 11 (1.61%) Algorithms
10 10 (1.47%) Graphic Design
10 10 (1.47%) Management Information System
11 9 (1.32%) NHS
12 8 (1.17%) SCADA
13 7 (1.03%) Onboarding
14 6 (0.88%) Multi-touch
15 5 (0.73%) Enterprise Software
15 5 (0.73%) Fibre Optics
15 5 (0.73%) Social Network
16 4 (0.59%) Hedge funds
16 4 (0.59%) Mobile App
Operating Systems
1 38 (5.57%) Windows
2 11 (1.61%) Linux
2 11 (1.61%) Windows Server
3 5 (0.73%) Mac OS X
3 5 (0.73%) Unix
3 5 (0.73%) Windows 10
4 2 (0.29%) Apple iOS
5 1 (0.15%) Android
5 1 (0.15%) Windows Server 2016
Processes & Methodologies
1 186 (27.27%) Digital Marketing
2 163 (23.90%) Analytics
3 128 (18.77%) Project Management
4 110 (16.13%) Collaborative Working
5 107 (15.69%) Marketing Strategy
6 103 (15.10%) Strategic Thinking
7 100 (14.66%) Problem-Solving
8 96 (14.08%) Artificial Intelligence
9 85 (12.46%) SEO
10 84 (12.32%) Business Development
11 78 (11.44%) Agile
12 74 (10.85%) Pay per click
13 72 (10.56%) Customer Retention
13 72 (10.56%) Time Management
14 61 (8.94%) E-Commerce
15 60 (8.80%) Mentoring
16 59 (8.65%) Continuous Improvement
17 58 (8.50%) Process Improvement
18 56 (8.21%) Analytical Thinking
19 55 (8.06%) Software Engineering
Programming Languages
1 86 (12.61%) Python
2 58 (8.50%) SQL
3 40 (5.87%) JavaScript
4 23 (3.37%) Java
5 22 (3.23%) PowerShell
6 21 (3.08%) Scala
7 17 (2.49%) C#
8 13 (1.91%) TypeScript
9 10 (1.47%) MATLAB
10 8 (1.17%) R
11 7 (1.03%) C++
12 4 (0.59%) Bash
12 4 (0.59%) Data Analysis Expressions
12 4 (0.59%) PL/SQL
13 3 (0.44%) PHP
14 2 (0.29%) C
14 2 (0.29%) Shell Script
14 2 (0.29%) SQR
14 2 (0.29%) T-SQL
14 2 (0.29%) VB.NET
Qualifications
1 120 (17.60%) Degree
2 25 (3.67%) Security Cleared
3 21 (3.08%) Computer Science Degree
3 21 (3.08%) SC Cleared
4 15 (2.20%) DBS Check
5 12 (1.76%) Master's Degree
6 9 (1.32%) DV Cleared
7 4 (0.59%) Azure Certification
7 4 (0.59%) CCNA
7 4 (0.59%) Cisco Certification
7 4 (0.59%) Microsoft Certification
7 4 (0.59%) NVQ Level 3
7 4 (0.59%) PhD
8 3 (0.44%) CCNP
8 3 (0.44%) HNC
9 2 (0.29%) JNCIS
9 2 (0.29%) MCP
9 2 (0.29%) Postgraduate
9 2 (0.29%) TOGAF Certification
10 1 (0.15%) BPSS Clearance
Quality Assurance & Compliance
1 15 (2.20%) Accessibility
2 12 (1.76%) Data Quality
2 12 (1.76%) GDPR
3 8 (1.17%) QA
4 3 (0.44%) PCI DSS
5 2 (0.29%) PERC
5 2 (0.29%) SLA
6 1 (0.15%) California Consumer Privacy Act
6 1 (0.15%) Cyber Essentials
6 1 (0.15%) Cyber Essentials PLUS
6 1 (0.15%) DO-254
6 1 (0.15%) Dodd-Frank
6 1 (0.15%) ISO 9000
6 1 (0.15%) ISO/IEC 27001
6 1 (0.15%) MiFID
6 1 (0.15%) NIST
6 1 (0.15%) PMO
System Software
1 18 (2.64%) Active Directory
2 14 (2.05%) Docker
3 5 (0.73%) VMware Infrastructure
4 4 (0.59%) Virtual Machines
5 3 (0.44%) Hyper-V
6 1 (0.15%) Firmware
6 1 (0.15%) ISA Server
Systems Management
1 19 (2.79%) Terraform
2 7 (1.03%) Ansible
3 6 (0.88%) Kubernetes
4 5 (0.73%) Grafana
4 5 (0.73%) Jamf Pro
5 4 (0.59%) Microsoft Intune
6 3 (0.44%) Kibana
6 3 (0.44%) Prometheus
7 2 (0.29%) Control-M
7 2 (0.29%) Docker Swarm
7 2 (0.29%) logstash
7 2 (0.29%) SCCM
7 2 (0.29%) SCOM
7 2 (0.29%) SCSM
7 2 (0.29%) WMI
8 1 (0.15%) Argo
8 1 (0.15%) FortiGate
8 1 (0.15%) Nessus
8 1 (0.15%) WSUS
Vendors
1 163 (23.90%) Google
2 118 (17.30%) Microsoft
3 57 (8.36%) Facebook
4 32 (4.69%) Instagram
5 30 (4.40%) Salesforce
6 26 (3.81%) TikTok
7 24 (3.52%) Apple
8 22 (3.23%) Adobe
9 18 (2.64%) Pinterest
10 15 (2.20%) Citrix
10 15 (2.20%) VMware
11 14 (2.05%) Oracle
11 14 (2.05%) YouTube
12 13 (1.91%) Cisco
13 9 (1.32%) Siemens
14 7 (1.03%) Ahrefs
14 7 (1.03%) Databricks
14 7 (1.03%) Screaming Frog
14 7 (1.03%) Sitecore
15 6 (0.88%) HubSpot