Prototyping
UK

The following table provides summary statistics for permanent job vacancies with a requirement for Prototyping skills. Included is a benchmarking guide to the salaries offered in vacancies that have cited Prototyping over the 6 months to 28 November 2023 with a comparison to the same period in the previous 2 years.

6 months to
28 Nov 2023
Same period 2022 Same period 2021
Rank 334 258 274
Rank change year-on-year -76 +16 +39
Permanent jobs citing Prototyping 488 1,807 1,715
As % of all permanent jobs advertised in the UK 0.90% 1.44% 1.34%
As % of the Processes & Methodologies category 0.95% 1.50% 1.40%
Number of salaries quoted 342 766 821
10th Percentile £38,775 £41,250 £38,037
25th Percentile £47,813 £50,621 £45,375
Median annual salary (50th Percentile) £65,000 £67,500 £56,500
Median % change year-on-year -3.70% +19.47% -13.08%
75th Percentile £78,438 £78,750 £77,500
90th Percentile £92,500 £90,000 £91,250
UK excluding London median annual salary £55,000 £65,000 £50,000
% change year-on-year -15.38% +30.00% -1.96%

All Process and Methodology Skills
UK

Prototyping is in the Processes and Methodologies category. The following table is for comparison with the above and provides summary statistics for all permanent job vacancies with a requirement for process or methodology skills.

Permanent vacancies with a requirement for process or methodology skills 51,121 120,104 122,523
As % of all permanent jobs advertised in the UK 94.09% 95.72% 95.43%
Number of salaries quoted 36,956 73,203 81,032
10th Percentile £32,500 £34,313 £32,500
25th Percentile £43,750 £45,000 £42,500
Median annual salary (50th Percentile) £60,000 £60,000 £59,000
Median % change year-on-year - +1.69% +7.27%
75th Percentile £80,000 £81,250 £77,500
90th Percentile £98,750 £100,000 £95,000
UK excluding London median annual salary £52,500 £53,000 £50,000
% change year-on-year -0.94% +6.00% +4.17%

Prototyping
Job Vacancy Trend

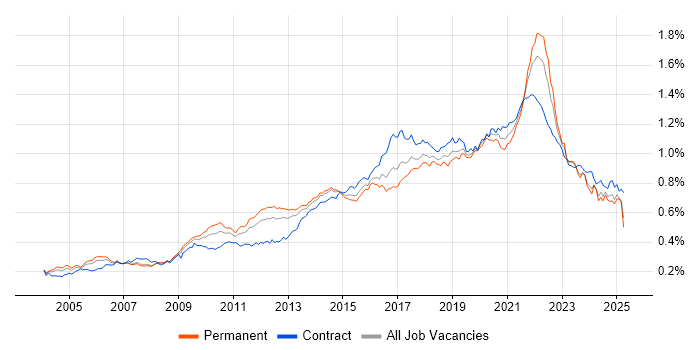
Job postings citing Prototyping as a proportion of all IT jobs advertised.

Job vacancy trend for Prototyping in the UK

Prototyping
Salary Trend

3-month moving average salary quoted in jobs citing Prototyping.

Salary trend for Prototyping in the UK

Prototyping
Salary Histogram

Salary distribution for jobs citing Prototyping over the 6 months to 28 November 2023.

Salary histogram for Prototyping in the UK

Prototyping
Top 17 Job Locations

The table below looks at the demand and provides a guide to the median salaries quoted in IT jobs citing Prototyping within the UK over the 6 months to 28 November 2023. The 'Rank Change' column provides an indication of the change in demand within each location based on the same 6 month period last year.

Location Rank Change
on Same Period
Last Year
Matching
Permanent
IT Job Ads
Median Salary
Past 6 Months
Median Salary
% Change
on Same Period
Last Year
Live
Jobs
England -85 377 £65,000 -3.70% 392
UK excluding London -26 308 £55,000 -15.38% 270
Work from Home -46 218 £67,500 -3.57% 143
London -77 160 £70,000 - 155
Scotland +40 82 £70,000 +12.00% 14
Midlands +58 60 £55,000 +19.57% 38
North of England +10 54 £52,500 -12.50% 30
West Midlands +51 50 £55,000 +19.57% 29
South West +41 36 £44,415 -22.76% 47
North West +20 32 £53,750 -15.84% 19
South East -30 31 £58,000 -17.14% 90
East of England +63 29 £75,000 +57.89% 49
Yorkshire +65 14 £46,250 +8.82% 7
Wales +2 14 £65,000 +44.44% 8
East Midlands +36 10 £50,000 +5.26% 9
North East +37 8 £65,000 +30.00% 4
Northern Ireland +35 2 £65,000 +30.00%

Prototyping
Co-occurring Skills and Capabilities by Category

The follow tables expand on the table above by listing co-occurrences grouped by category. The same employment type, locality and period is covered with up to 20 co-occurrences shown in each of the following categories:

Application Platforms
1 23 (4.71%) IIS
2 11 (2.25%) Confluence
3 9 (1.84%) WordPress
4 6 (1.23%) CMS
5 5 (1.02%) SharePoint
6 4 (0.82%) Oracle Application Server
7 3 (0.61%) Drupal
7 3 (0.61%) Headless CMS
8 2 (0.41%) Apache Spark
8 2 (0.41%) IBM Domino
8 2 (0.41%) Liferay
9 1 (0.20%) Artix
9 1 (0.20%) Kentico
9 1 (0.20%) OpenStack
9 1 (0.20%) Sitecore CMS
9 1 (0.20%) Umbraco
Applications
1 44 (9.02%) Simulink
2 37 (7.58%) Sketch
2 37 (7.58%) Stateflow
3 19 (3.89%) Adobe XD
4 15 (3.07%) InVision
5 7 (1.43%) Microsoft Excel
6 4 (0.82%) Adobe Creative Suite
6 4 (0.82%) Microsoft Office
7 3 (0.61%) Chatbot
7 3 (0.61%) Microsoft PowerPoint
8 2 (0.41%) MS Visio
9 1 (0.20%) AutoCAD
9 1 (0.20%) CATIA
9 1 (0.20%) Marvel
9 1 (0.20%) Microsoft Project
9 1 (0.20%) Photoshop
9 1 (0.20%) PTC Creo
9 1 (0.20%) SOLIDWORKS
9 1 (0.20%) UserZoom
9 1 (0.20%) Windchill
Business Applications
1 3 (0.61%) Salesforce CRM
2 2 (0.41%) Dynamics CRM
3 1 (0.20%) Oracle ERP
3 1 (0.20%) SAP ERP
3 1 (0.20%) SAP MDG
3 1 (0.20%) SAP Retail
3 1 (0.20%) SAP S/4HANA
3 1 (0.20%) SAP SD
3 1 (0.20%) Teamcenter
Cloud Services
1 115 (23.57%) AWS
2 76 (15.57%) Azure
3 53 (10.86%) Figma
4 46 (9.43%) SaaS
5 44 (9.02%) Cloud Computing
6 38 (7.79%) GitHub
7 35 (7.17%) GCP
8 32 (6.56%) Amazon ECS
9 31 (6.35%) AWS CloudFormation
9 31 (6.35%) dbt
10 26 (5.33%) Amazon EC2
11 20 (4.10%) Serverless
12 17 (3.48%) Pulumi
13 16 (3.28%) AWS Lambda
14 14 (2.87%) PaaS
15 11 (2.25%) Power Platform
16 10 (2.05%) npm
17 9 (1.84%) Amazon S3
17 9 (1.84%) GitHub Actions
17 9 (1.84%) Google Analytics
Communications & Networking
1 30 (6.15%) TCP/IP
2 23 (4.71%) WAN
3 21 (4.30%) Internet
4 6 (1.23%) Ethernet
4 6 (1.23%) Network Security
5 3 (0.61%) Software-Defined Radio
5 3 (0.61%) SSH
5 3 (0.61%) Wireshark
6 2 (0.41%) 2G
6 2 (0.41%) 3G
6 2 (0.41%) 4G
6 2 (0.41%) Cisco ASA
6 2 (0.41%) Cisco Firepower
6 2 (0.41%) Cisco ISE
6 2 (0.41%) GSM
6 2 (0.41%) HTTP
6 2 (0.41%) Intranet
6 2 (0.41%) NetScaler
7 1 (0.20%) DSL
7 1 (0.20%) Kerberos
Database & Business Intelligence
1 42 (8.61%) MySQL
2 35 (7.17%) PostgreSQL
3 33 (6.76%) Elasticsearch
4 26 (5.33%) Amazon RDS
4 26 (5.33%) Redis
5 24 (4.92%) SQL Server
6 21 (4.30%) NoSQL
7 9 (1.84%) Power BI
8 5 (1.02%) Relational Database
9 4 (0.82%) Oracle Database
9 4 (0.82%) Oracle Database 12c
10 3 (0.61%) Big Data
10 3 (0.61%) Data Warehouse
10 3 (0.61%) Metadata
10 3 (0.61%) Tableau
11 2 (0.41%) Hadoop
11 2 (0.41%) KDB
11 2 (0.41%) MongoDB
12 1 (0.20%) Apache Hive
12 1 (0.20%) SQLite
Development Applications
1 61 (12.50%) Jenkins
2 52 (10.66%) Git
3 26 (5.33%) IntelliJ
3 26 (5.33%) Maven
4 15 (3.07%) JIRA
5 6 (1.23%) webpack
6 5 (1.02%) gulp
6 5 (1.02%) Oracle APEX
7 4 (0.82%) Cypress.io
7 4 (0.82%) GitLab
7 4 (0.82%) IDA Disassembler
7 4 (0.82%) Robot Framework
7 4 (0.82%) Sonatype Nexus
8 3 (0.61%) Atlassian Bamboo
8 3 (0.61%) Axure RP
8 3 (0.61%) Bitbucket
8 3 (0.61%) MSI
9 2 (0.41%) Rational DOORS
9 2 (0.41%) Selenium
9 2 (0.41%) Subversion
General
1 120 (24.59%) Social Skills
2 98 (20.08%) Finance
3 48 (9.84%) Analytical Skills
4 47 (9.63%) Inclusion and Diversity
5 40 (8.20%) Electronics
6 28 (5.74%) Automotive
7 27 (5.53%) Marketing
8 26 (5.33%) Public Sector
9 25 (5.12%) Games
10 19 (3.89%) Influencing Skills
10 19 (3.89%) Multimedia
11 17 (3.48%) Esports
12 16 (3.28%) Manufacturing
12 16 (3.28%) Telecoms
13 15 (3.07%) Retail
14 12 (2.46%) Health Technology
15 10 (2.05%) Law
16 9 (1.84%) Pharmaceutical
16 9 (1.84%) Presentation Skills
17 7 (1.43%) Front Office
Job Titles
1 144 (29.51%) Senior
2 98 (20.08%) Developer
3 95 (19.47%) Designer
4 54 (11.07%) Lead
4 54 (11.07%) Systems Engineer
5 41 (8.40%) Senior Developer
6 36 (7.38%) UX Designer
7 34 (6.97%) Senior Designer
8 32 (6.56%) Control Systems Engineer
8 32 (6.56%) UI Designer
9 30 (6.15%) React Developer
10 27 (5.53%) Java Developer
10 27 (5.53%) Senior React Developer
11 26 (5.33%) J2EE Developer
11 26 (5.33%) Java/J2EE Developer
11 26 (5.33%) JavaScript Developer
11 26 (5.33%) Senior J2EE Developer
11 26 (5.33%) Senior Java Developer
11 26 (5.33%) Senior Java/J2EE Developer
11 26 (5.33%) Senior UI Designer
Libraries, Frameworks & Software Standards
1 63 (12.91%) HTML
2 62 (12.70%) CSS
3 52 (10.66%) React
4 40 (8.20%) AngularJS
5 34 (6.97%) Django
6 29 (5.94%) J2EE
6 29 (5.94%) Redux
7 27 (5.53%) .NET
8 26 (5.33%) jOOQ
8 26 (5.33%) React Native
9 21 (4.30%) JSON
9 21 (4.30%) Node.js
10 20 (4.10%) RESTful
11 18 (3.69%) Direct3D
11 18 (3.69%) OpenGL
11 18 (3.69%) OpenGL ES
11 18 (3.69%) Vulkan
12 17 (3.48%) Twitter Bootstrap
13 16 (3.28%) HTML5
14 15 (3.07%) Next.js
Miscellaneous
1 52 (10.66%) Algorithms
2 49 (10.04%) Self-Motivation
3 47 (9.63%) Distributed Systems
4 46 (9.43%) Renewable Energy
5 35 (7.17%) Management Information System
6 31 (6.35%) 3D Graphics
7 24 (4.92%) IoT
7 24 (4.92%) Product Ownership
8 23 (4.71%) Clustering
9 21 (4.30%) Cloud Native
10 19 (3.89%) Public Cloud
11 18 (3.69%) Mali
11 18 (3.69%) Smartphone
11 18 (3.69%) Virtual Team
12 14 (2.87%) Graphic Design
13 12 (2.46%) Sports Betting
14 11 (2.25%) Embedded Systems
14 11 (2.25%) Mobile App
15 9 (1.84%) Photography
16 8 (1.64%) Legacy Systems
Operating Systems
1 37 (7.58%) Linux
1 37 (7.58%) Unix
2 27 (5.53%) Android
3 26 (5.33%) Mac OS
4 11 (2.25%) Windows
5 6 (1.23%) Apple iOS
5 6 (1.23%) Windows Server
6 5 (1.02%) Windows Server 2019
7 2 (0.41%) Debian
8 1 (0.20%) CentOS
8 1 (0.20%) MVS
8 1 (0.20%) Red Hat Enterprise Linux
8 1 (0.20%) Ubuntu
Processes & Methodologies
1 158 (32.38%) Agile
2 138 (28.28%) Problem-Solving
3 126 (25.82%) User Experience
4 110 (22.54%) UX Design
5 90 (18.44%) Rapid Prototyping
6 81 (16.60%) Software Engineering
7 68 (13.93%) Computer Science
8 66 (13.52%) DevOps
9 65 (13.32%) User Research
10 64 (13.11%) Wireframes
11 61 (12.50%) Validation
12 55 (11.27%) Analytics
13 54 (11.07%) Continuous Integration
14 53 (10.86%) CI/CD
15 47 (9.63%) Machine Learning
16 46 (9.43%) Continuous Delivery
16 46 (9.43%) Front End Development
16 46 (9.43%) User-Centered Design (UCD)
17 44 (9.02%) Commercialisation
17 44 (9.02%) Design Patterns
Programming Languages
1 122 (25.00%) Python
2 79 (16.19%) SQL
3 75 (15.37%) JavaScript
4 61 (12.50%) Java
5 58 (11.89%) MATLAB
6 39 (7.99%) TypeScript
7 35 (7.17%) C
8 34 (6.97%) Bash
9 30 (6.15%) C#
10 29 (5.94%) C++
11 10 (2.05%) Go
11 10 (2.05%) PowerShell
12 6 (1.23%) PHP
13 5 (1.02%) PL/SQL
14 3 (0.61%) R
15 2 (0.41%) ANSI C
15 2 (0.41%) Embedded C
15 2 (0.41%) Rust
16 1 (0.20%) Assembly Language
16 1 (0.20%) Kotlin
Qualifications
1 121 (24.80%) Security Cleared
2 115 (23.57%) Degree
3 71 (14.55%) SC Cleared
4 41 (8.40%) Computer Science Degree
5 35 (7.17%) Master's Degree
6 28 (5.74%) DV Cleared
7 21 (4.30%) PhD
8 8 (1.64%) BPSS Clearance
9 2 (0.41%) CCNP
9 2 (0.41%) CCSE
9 2 (0.41%) Cisco Certification
9 2 (0.41%) Microsoft Certification
10 1 (0.20%) APMP
10 1 (0.20%) DBS Check
10 1 (0.20%) HNC
10 1 (0.20%) ISEB
10 1 (0.20%) MCAD
10 1 (0.20%) MCSA
10 1 (0.20%) PMI Certification
10 1 (0.20%) PMP
Quality Assurance & Compliance
1 37 (7.58%) Accessibility
2 10 (2.05%) QA
3 9 (1.84%) GDPR
3 9 (1.84%) ISO/IEC 27001
4 7 (1.43%) WCAG
5 6 (1.23%) ITGC
6 2 (0.41%) COSHH
6 2 (0.41%) Cyber Essentials
6 2 (0.41%) Data Quality
6 2 (0.41%) JTAG
6 2 (0.41%) PMO
7 1 (0.20%) AUTOSAR
7 1 (0.20%) ISO 26262
7 1 (0.20%) ISO 9001
7 1 (0.20%) MISRA
7 1 (0.20%) SLA
System Software
1 40 (8.20%) Docker
2 23 (4.71%) VMware NSX
3 10 (2.05%) VMware Infrastructure
4 6 (1.23%) Active Directory
4 6 (1.23%) Firmware
5 1 (0.20%) Ceph
5 1 (0.20%) Embedded Firmware
5 1 (0.20%) GPFS
5 1 (0.20%) KVM
5 1 (0.20%) Lustre
5 1 (0.20%) RACF
5 1 (0.20%) Slurm Workload Manager
5 1 (0.20%) vSphere
5 1 (0.20%) XenApp
Systems Management
1 46 (9.43%) Kubernetes
2 42 (8.61%) Terraform
3 10 (2.05%) Puppet
4 5 (1.02%) Ansible
4 5 (1.02%) Argo
4 5 (1.02%) Nessus
5 3 (0.61%) Istio
5 3 (0.61%) WMI
6 2 (0.41%) Single Sign-On
7 1 (0.20%) Grafana
7 1 (0.20%) Icinga
7 1 (0.20%) Kustomize
7 1 (0.20%) Podman
7 1 (0.20%) Prometheus
7 1 (0.20%) SCCM
7 1 (0.20%) SCOM
7 1 (0.20%) SELinux
Vendors
1 50 (10.25%) Microsoft
2 36 (7.38%) Google
3 33 (6.76%) Adobe
4 30 (6.15%) VMware
5 22 (4.51%) Salesforce
6 9 (1.84%) SAP
7 8 (1.64%) Hotjar
8 7 (1.43%) Oracle
9 4 (0.82%) Mercator
10 3 (0.61%) Cisco
10 3 (0.61%) Fortinet
11 2 (0.41%) Apple
11 2 (0.41%) CheckPoint
11 2 (0.41%) EMC
11 2 (0.41%) F5
11 2 (0.41%) Facebook
11 2 (0.41%) Instagram
11 2 (0.41%) Palo Alto
11 2 (0.41%) Zscaler
12 1 (0.20%) Spotify