Master's Degree
UK

The following table provides summary statistics for permanent job vacancies with a requirement for Master's Degree qualifications. Included is a benchmarking guide to the salaries offered over the 6 months to 10 December 2023 with a comparison to the same period in the previous 2 years.

6 months to
10 Dec 2023
Same period 2022 Same period 2021
Rank 198 174 227
Rank change year-on-year -24 +53 +43
Permanent jobs citing Master's Degree 955 2,687 2,090
As % of all permanent jobs advertised in the UK 1.83% 2.20% 1.64%
As % of the Qualifications category 5.60% 7.47% 6.66%
Number of salaries quoted 530 902 898
10th Percentile £41,250 £33,447 £41,750
25th Percentile £55,000 £46,250 £52,031
Median annual salary (50th Percentile) £77,500 £62,500 £72,500
Median % change year-on-year +24.00% -13.79% +11.54%
75th Percentile £103,438 £87,500 £95,000
90th Percentile £137,500 £105,000 £118,750
UK excluding London median annual salary £62,500 £60,000 £55,000
% change year-on-year +4.17% +9.09% -

All Academic and Professional Certifications
UK

Master's Degree is in the Academic Qualifications and Professional Certifications category. The following table is for comparison with the above and provides summary statistics for all permanent job vacancies with a requirement for academic qualifications or professional certifications.

Permanent vacancies requiring academic qualifications or professional certifications 17,067 35,981 31,364
As % of all permanent jobs advertised in the UK 32.65% 29.44% 24.68%
Number of salaries quoted 10,705 16,977 17,903
10th Percentile £31,000 £31,250 £31,250
25th Percentile £41,670 £41,250 £41,250
Median annual salary (50th Percentile) £57,500 £57,500 £55,000
Median % change year-on-year - +4.55% -
75th Percentile £75,000 £76,250 £73,750
90th Percentile £92,500 £93,750 £90,000
UK excluding London median annual salary £52,500 £50,000 £50,000
% change year-on-year +5.00% - +2.04%

Master's Degree
Job Vacancy Trend

Job postings citing Master's Degree as a proportion of all IT jobs advertised.
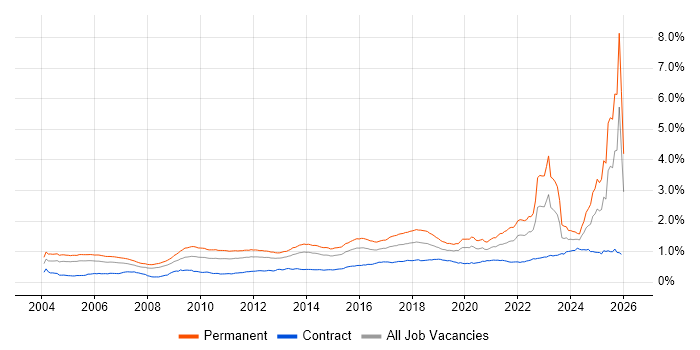
Job vacancy trend for Master's Degree in the UK

Master's Degree
Salary Trend

3-month moving average salary quoted in jobs citing Master's Degree.

Salary trend for Master's Degree in the UK

Master's Degree
Salary Histogram

Salary distribution for jobs citing Master's Degree over the 6 months to 10 December 2023.

Salary histogram for Master's Degree in the UK

Master's Degree
Top 17 Job Locations

The table below looks at the demand and provides a guide to the median salaries quoted in IT jobs citing Master's Degree within the UK over the 6 months to 10 December 2023. The 'Rank Change' column provides an indication of the change in demand within each location based on the same 6 month period last year.

Location Rank Change
on Same Period
Last Year
Matching
Permanent
IT Job Ads
Median Salary
Past 6 Months
Median Salary
% Change
on Same Period
Last Year
Live
Jobs
England +1 872 £80,000 +28.00% 1,186
London +91 554 £90,000 +12.50% 602
UK excluding London -109 350 £62,500 +4.17% 667
Work from Home -9 204 £70,600 +8.39% 657
South East -100 80 £55,000 -8.33% 249
North of England -4 64 £48,375 -7.86% 108
South West -24 62 £66,250 +63.58% 54
East of England +3 57 £60,000 -14.29% 126
Midlands +16 44 £37,500 -37.50% 77
North West +42 40 £46,023 -23.30% 60
West Midlands +38 28 £28,500 -48.18% 47
Yorkshire +6 21 £57,630 +9.77% 35
Scotland -20 21 £85,000 +54.55% 39
Wales -15 20 £66,000 +5.77% 18
East Midlands +22 16 £50,000 -16.67% 29
North East +24 3 £97,500 +107.45% 15
Northern Ireland -16 3 £43,750 -32.69% 8

Master's Degree
Co-occurring Skills and Capabilities by Category

The follow tables expand on the table above by listing co-occurrences grouped by category. The same employment type, locality and period is covered with up to 20 co-occurrences shown in each of the following categories:

Application Platforms
1 102 (10.68%) MS Exchange
2 26 (2.72%) Apache Spark
3 14 (1.47%) Apache Airflow
4 12 (1.26%) SharePoint
5 10 (1.05%) Confluence
6 9 (0.94%) SAS
7 8 (0.84%) Apache
7 8 (0.84%) CMS
8 3 (0.31%) Luigi
9 1 (0.10%) Apache Pulsar
9 1 (0.10%) IIS
9 1 (0.10%) Jupyter
9 1 (0.10%) OpenStack
9 1 (0.10%) Tomcat
9 1 (0.10%) WordPress
Applications
1 25 (2.62%) Microsoft Excel
2 13 (1.36%) Microsoft PowerPoint
3 10 (1.05%) Microsoft Office
4 8 (0.84%) Simulink
5 7 (0.73%) MS Visio
6 4 (0.42%) Spreadsheet
7 3 (0.31%) 3ds Max
7 3 (0.31%) Blender
7 3 (0.31%) Maya
8 2 (0.21%) Adobe Creative Suite
8 2 (0.21%) AutoCAD
8 2 (0.21%) Sketch
8 2 (0.21%) Trello
9 1 (0.10%) Adobe XD
9 1 (0.10%) Microsoft Project
9 1 (0.10%) OrCAD
9 1 (0.10%) SOLIDWORKS
9 1 (0.10%) SPSS
Business Applications
1 10 (1.05%) Oracle EBS
2 3 (0.31%) Hyperion Planning
2 3 (0.31%) SAP Oil and Gas
2 3 (0.31%) SAP S/4HANA
3 1 (0.10%) Cerner Millennium
3 1 (0.10%) Dynamics CRM
3 1 (0.10%) Endur
3 1 (0.10%) SAP ERP
3 1 (0.10%) SAP GTS
3 1 (0.10%) SAP SCM
3 1 (0.10%) Sparx Enterprise Architect
Cloud Services
1 186 (19.48%) AWS
2 158 (16.54%) Azure
3 112 (11.73%) Microsoft 365
4 50 (5.24%) GCP
4 50 (5.24%) Power Platform
5 23 (2.41%) GitHub
6 20 (2.09%) SaaS
7 19 (1.99%) Azure Synapse Analytics
8 17 (1.78%) Azure DevOps
9 16 (1.68%) PaaS
10 15 (1.57%) Cloud Computing
10 15 (1.57%) IaaS
11 13 (1.36%) Serverless
12 12 (1.26%) Amazon S3
12 12 (1.26%) Azure Cosmos DB
13 11 (1.15%) AWS CodePipeline
13 11 (1.15%) Google Analytics
14 10 (1.05%) Azure Monitor
14 10 (1.05%) Sentry
14 10 (1.05%) Snowflake
Communications & Networking
1 110 (11.52%) Wireless
2 104 (10.89%) WAN
3 102 (10.68%) Cisco IOS
3 102 (10.68%) SD-WAN
3 102 (10.68%) WebEx
4 32 (3.35%) Firewall
5 22 (2.30%) Internet
6 14 (1.47%) Network Security
7 11 (1.15%) TCP/IP
8 7 (0.73%) Software-Defined Radio
9 4 (0.42%) Intrusion Detection
9 4 (0.42%) LAN
9 4 (0.42%) VPN
10 3 (0.31%) 3GPP
10 3 (0.31%) DHCP
10 3 (0.31%) DNS
10 3 (0.31%) LTE
10 3 (0.31%) MIMO
10 3 (0.31%) NetScaler
10 3 (0.31%) PPP
Database & Business Intelligence
1 50 (5.24%) Power BI
2 34 (3.56%) Tableau
3 33 (3.46%) Data Lake
4 27 (2.83%) Big Data
5 26 (2.72%) Data Warehouse
5 26 (2.72%) SQL Server
6 19 (1.99%) SQL Server Reporting Services
7 18 (1.88%) NoSQL
8 16 (1.68%) Hadoop
8 16 (1.68%) SQL Server Integration Services
9 14 (1.47%) Azure SQL Database
10 12 (1.26%) Apache Hive
10 12 (1.26%) Relational Database
11 10 (1.05%) Amazon Redshift
11 10 (1.05%) Impala
11 10 (1.05%) KDB
11 10 (1.05%) PostgreSQL
11 10 (1.05%) Presto
12 9 (0.94%) Kdb+
12 9 (0.94%) MySQL
Development Applications
1 37 (3.87%) Git
2 24 (2.51%) JIRA
3 11 (1.15%) Jenkins
4 10 (1.05%) CircleCI
4 10 (1.05%) GitLab
5 7 (0.73%) Artifactory
5 7 (0.73%) git-flow
5 7 (0.73%) Sonatype Nexus
6 3 (0.31%) Android Studio
6 3 (0.31%) Selenium
7 2 (0.21%) Burp Suite
7 2 (0.21%) Cucumber
7 2 (0.21%) ERwin
7 2 (0.21%) Maven
7 2 (0.21%) Metasploit
7 2 (0.21%) Postman
7 2 (0.21%) Snakemake
7 2 (0.21%) SpecFlow
7 2 (0.21%) Visual Studio
8 1 (0.10%) ER Studio
General
1 425 (44.50%) Social Skills
2 217 (22.72%) Finance
3 197 (20.63%) Analytical Skills
4 68 (7.12%) Public Sector
5 56 (5.86%) Presentation Skills
6 47 (4.92%) Legal
7 44 (4.61%) Telecoms
8 43 (4.50%) Banking
8 43 (4.50%) Electronics
9 42 (4.40%) Inclusion and Diversity
9 42 (4.40%) Marketing
10 38 (3.98%) Automotive
11 30 (3.14%) Retail
12 27 (2.83%) Front Office
13 24 (2.51%) Military
14 22 (2.30%) Investment Banking
14 22 (2.30%) Law
15 21 (2.20%) Manufacturing
15 21 (2.20%) Pharmaceutical
16 18 (1.88%) Multimedia
Job Titles
1 182 (19.06%) Senior
2 110 (11.52%) Developer
3 106 (11.10%) Support Specialist
4 103 (10.79%) IT Support
5 102 (10.68%) IT Support Specialist
6 94 (9.84%) Analyst
7 83 (8.69%) Graduate
8 75 (7.85%) Lead
9 72 (7.54%) Architect
10 51 (5.34%) Data Scientist
11 43 (4.50%) Software Engineer
12 33 (3.46%) Data Engineer
13 32 (3.35%) Consultant
14 29 (3.04%) Senior Manager
15 28 (2.93%) Junior
16 26 (2.72%) Senior Data Scientist
16 26 (2.72%) Senior Developer
17 24 (2.51%) Qualitative Analyst
17 24 (2.51%) Quantitative Analyst
18 23 (2.41%) Solutions Architect
Libraries, Frameworks & Software Standards
1 34 (3.56%) .NET
2 24 (2.51%) HTML
3 23 (2.41%) JSON
4 21 (2.20%) OpenGL ES
4 21 (2.20%) Vulkan
5 20 (2.09%) CSS
5 20 (2.09%) Kafka
5 20 (2.09%) Pandas
5 20 (2.09%) PyTorch
6 18 (1.88%) Direct3D
6 18 (1.88%) OpenGL
6 18 (1.88%) PySpark
7 16 (1.68%) TensorFlow
8 15 (1.57%) React
9 14 (1.47%) NumPy
10 12 (1.26%) Node.js
11 11 (1.15%) ASP.NET
11 11 (1.15%) scikit-learn
11 11 (1.15%) Spring
12 10 (1.05%) jQuery
Miscellaneous
1 102 (10.68%) Wiki
2 91 (9.53%) Video Conferencing
3 90 (9.42%) Algorithms
4 62 (6.49%) Management Information System
5 48 (5.03%) Driving Licence
6 33 (3.46%) PKI
7 31 (3.25%) Hedge funds
8 30 (3.14%) Data Structures
9 29 (3.04%) Renewable Energy
10 27 (2.83%) Foreign Exchange (FX)
10 27 (2.83%) Self-Motivation
11 26 (2.72%) IoT
12 25 (2.62%) Cyberattack
13 21 (2.20%) 3D Graphics
14 19 (1.99%) Onboarding
15 18 (1.88%) Distributed Systems
15 18 (1.88%) Fixed Income
15 18 (1.88%) Mali
15 18 (1.88%) Smartphone
16 17 (1.78%) Equities
Operating Systems
1 140 (14.66%) Windows
2 129 (13.51%) Android
3 103 (10.79%) Windows 10
4 54 (5.65%) Linux
5 17 (1.78%) Unix
6 9 (0.94%) Mac OS
6 9 (0.94%) Windows Server
7 6 (0.63%) Apple iOS
8 4 (0.42%) Mac OS X
9 2 (0.21%) Kali Linux
10 1 (0.10%) Debian
10 1 (0.10%) Ubuntu
10 1 (0.10%) VxWorks
Processes & Methodologies
1 525 (54.97%) Computer Science
2 308 (32.25%) Problem-Solving
3 165 (17.28%) Analytics
4 160 (16.75%) Agile
5 145 (15.18%) Software Engineering
6 143 (14.97%) Data Science
7 131 (13.72%) Mathematics
8 127 (13.30%) Machine Learning
9 112 (11.73%) Contract Negotiation
10 108 (11.31%) Cybersecurity
11 105 (10.99%) Business Continuity
12 102 (10.68%) BCP
12 102 (10.68%) Business Continuity Planning
12 102 (10.68%) Mobile Device Management
13 98 (10.26%) Project Management
14 94 (9.84%) Decision-Making
15 91 (9.53%) Application Virtualisation
15 91 (9.53%) Statistics
16 83 (8.69%) Physics
17 73 (7.64%) Continuous Improvement
Programming Languages
1 299 (31.31%) Python
2 168 (17.59%) SQL
3 150 (15.71%) C++
4 95 (9.95%) Java
5 89 (9.32%) C#
6 55 (5.76%) JavaScript
7 50 (5.24%) C
8 48 (5.03%) R
9 29 (3.04%) Bash
10 26 (2.72%) MATLAB
11 16 (1.68%) PowerShell
12 15 (1.57%) Scala
13 13 (1.36%) Fortran
14 12 (1.26%) PL/SQL
15 11 (1.15%) T-SQL
16 7 (0.73%) Bicep
17 6 (0.63%) Go
17 6 (0.63%) Gremlin
17 6 (0.63%) Kotlin
17 6 (0.63%) SPARQL
Qualifications
1 954 (99.90%) Degree
2 319 (33.40%) Computer Science Degree
3 170 (17.80%) PhD
4 91 (9.53%) Security Cleared
5 58 (6.07%) MBA
6 33 (3.46%) Azure Certification
6 33 (3.46%) CISSP
7 31 (3.25%) AWS Certification
8 29 (3.04%) SC Cleared
9 21 (2.20%) Microsoft Certification
10 19 (1.99%) CISM
11 16 (1.68%) CESG Certified Professional
12 15 (1.57%) CFA
12 15 (1.57%) DV Cleared
13 10 (1.05%) AWS Certified Solutions Architect
14 9 (0.94%) AWS Certified DevOps Engineer
14 9 (0.94%) BPSS Clearance
14 9 (0.94%) DBS Check
14 9 (0.94%) PMI Certification
15 8 (0.84%) Chartered Engineer
Quality Assurance & Compliance
1 61 (6.39%) ISO/IEC 27001
2 31 (3.25%) HMG Security Policy Framework
3 25 (2.62%) QA
4 21 (2.20%) NIST
5 19 (1.99%) Data Quality
6 16 (1.68%) NCSC
7 12 (1.26%) PCI DSS
8 8 (0.84%) GDPR
9 7 (0.73%) Cyber Essentials
10 4 (0.42%) GxP
10 4 (0.42%) ISO/IEC 17025
11 3 (0.31%) Accessibility
11 3 (0.31%) Actionable Recommendations
11 3 (0.31%) Cyber Essentials PLUS
11 3 (0.31%) ISO 20022
11 3 (0.31%) PMO
12 2 (0.21%) Dodd-Frank
12 2 (0.21%) EMIR
12 2 (0.21%) IFRS
12 2 (0.21%) IFRS 9
System Software
1 112 (11.73%) Active Directory
2 105 (10.99%) XenApp
3 102 (10.68%) Microsoft App-V
3 102 (10.68%) VMware ESXi
3 102 (10.68%) XenDesktop
4 60 (6.28%) Docker
5 5 (0.52%) VMware Infrastructure
6 3 (0.31%) Citrix Hypervisor
7 2 (0.21%) Firmware
7 2 (0.21%) pfSense
7 2 (0.21%) Virtual Servers
7 2 (0.21%) vSphere
8 1 (0.10%) Embedded Firmware
8 1 (0.10%) HDFS
8 1 (0.10%) Hyper-V
Systems Management
1 102 (10.68%) SCCM
2 91 (9.53%) AirWatch
3 57 (5.97%) Kubernetes
4 16 (1.68%) Terraform
5 13 (1.36%) Grafana
6 12 (1.26%) Ansible
7 10 (1.05%) Kibana
7 10 (1.05%) Prometheus
8 8 (0.84%) Argo
9 7 (0.73%) Packer
10 4 (0.42%) vRealize
10 4 (0.42%) vRealize Orchestrator
11 2 (0.21%) Active Directory Federation Services
11 2 (0.21%) Dell DRAC
11 2 (0.21%) Nmap
11 2 (0.21%) Proxmox
12 1 (0.10%) ITRS Geneos
12 1 (0.10%) Kubeflow
12 1 (0.10%) Mesos
12 1 (0.10%) Puppet
Vendors
1 172 (18.01%) Microsoft
2 106 (11.10%) Citrix
3 105 (10.99%) Cisco
4 40 (4.19%) Google
5 35 (3.66%) Oracle
6 29 (3.04%) SAP
7 27 (2.83%) Bloomberg
8 24 (2.51%) Splunk
9 17 (1.78%) Databricks
10 11 (1.15%) Apple
10 11 (1.15%) Salesforce
11 9 (0.94%) ServiceNow
12 8 (0.84%) VMware
13 6 (0.63%) Alteryx
13 6 (0.63%) Atlassian
13 6 (0.63%) Dell
13 6 (0.63%) TOWER Software
14 5 (0.52%) Adobe
14 5 (0.52%) Zoho
15 4 (0.42%) Sun