System Engineer
UK

The median System Engineer salary in the UK is £52,500 per year according to job vacancies posted during the 6 months to 5 December 2023.

The first table below provides salary benchmarking and summary statistics including a comparison to same period in the previous 2 years.

6 months to
5 Dec 2023
Same period 2022 Same period 2021
Rank 240 296 379
Rank change year-on-year +56 +83 -11
Permanent jobs requiring a Systems Engineer 754 1,538 1,173
As % of all permanent jobs advertised in the UK 1.41% 1.24% 0.92%
As % of the Job Titles category 1.48% 1.30% 0.97%
Number of salaries quoted 379 508 574
10th Percentile £32,500 £35,000 £32,000
25th Percentile £40,000 £42,500 £36,250
Median annual salary (50th Percentile) £52,500 £51,750 £47,500
Median % change year-on-year +1.45% +8.95% +1.06%
75th Percentile £66,250 £70,000 £62,188
90th Percentile £75,000 £89,125 £72,500
UK excluding London median annual salary £48,500 £50,000 £45,000
% change year-on-year -3.00% +11.11% +5.88%

All Permanent IT Job Vacancies
UK

The following table is for comparison with the above and includes summary statistics for all permanent IT job vacancies. Most job vacancies include a discernible job title that can be normalized. As such, the figures in the second row provide an indication of the number of permanent jobs in our overall sample.

Permanent vacancies in the UK with a recognized job title 50,985 118,425 121,174
% of permanent jobs with a recognized job title 95.43% 95.37% 95.14%
Number of salaries quoted 37,346 74,222 83,417
10th Percentile £31,250 £32,750 £32,000
25th Percentile £42,500 £45,000 £42,500
Median annual salary (50th Percentile) £60,000 £60,000 £57,500
Median % change year-on-year - +4.35% +4.55%
75th Percentile £80,000 £81,250 £77,500
90th Percentile £97,500 £98,750 £95,000
UK excluding London median annual salary £52,500 £52,500 £50,000
% change year-on-year - +5.00% +5.26%

Systems Engineer
Job Vacancy Trend

Job postings that featured Systems Engineer in the job title as a proportion of all IT jobs advertised.
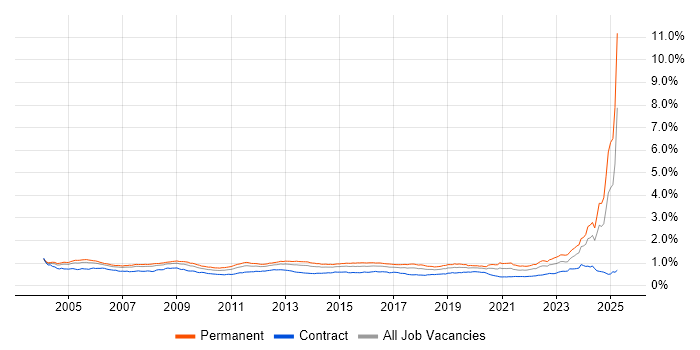
Job vacancy trend for Systems Engineer in the UK

Systems Engineer
Salary Trend

3-month moving average salary quoted in jobs citing Systems Engineer.

Salary trend for Systems Engineer in the UK

Systems Engineer
Salary Histogram

Salary distribution for jobs citing Systems Engineer over the 6 months to 5 December 2023.

Salary histogram for Systems Engineer in the UK

Systems Engineer
Top 17 Job Locations

The table below looks at the demand and provides a guide to the median salaries quoted in IT jobs citing Systems Engineer within the UK over the 6 months to 5 December 2023. The 'Rank Change' column provides an indication of the change in demand within each location based on the same 6 month period last year.

Location Rank Change
on Same Period
Last Year
Matching
Permanent
IT Job Ads
Median Salary
Past 6 Months
Median Salary
% Change
on Same Period
Last Year
Live
Jobs
England +48 668 £52,500 +1.94% 628
UK excluding London +5 573 £48,500 -3.00% 556
South East +25 196 £42,500 -15.00% 170
Work from Home -9 192 £55,000 -4.35% 208
London +194 168 £60,000 -13.56% 113
North of England +115 99 £52,500 +21.39% 87
South West -33 94 £62,500 +30.21% 99
Midlands +13 86 £48,050 +2.23% 100
West Midlands +22 65 £48,050 +2.23% 71
Scotland +57 61 £37,500 -29.55% 38
North West +96 56 £53,750 +14.36% 43
East of England +67 36 £66,250 +15.22% 66
Yorkshire +88 27 £45,000 +4.05% 37
East Midlands +26 21 £50,000 -2.91% 29
North East +54 16 £47,500 +29.25% 12
Wales +7 13 £37,500 - 18
Northern Ireland +36 4 - - 4

Systems Engineer Skill Set
Top 30 Co-occurring Skills and Capabilities

For the 6 months to 5 December 2023, Systems Engineer job roles required the following skills and capabilities in order of popularity. The figures indicate the absolute number co-occurrences and as a proportion of all permanent job ads featuring Systems Engineer in the job title.

1 303 (40.19%) SQL
2 241 (31.96%) Agile
3 183 (24.27%) Problem-Solving
4 181 (24.01%) Security Cleared
5 174 (23.08%) Management Information System
6 166 (22.02%) Asset Management
7 163 (21.62%) Microsoft
8 159 (21.09%) PL/SQL
8 159 (21.09%) NEC
8 159 (21.09%) Compliance Management
9 148 (19.63%) Windows
10 145 (19.23%) Degree
11 138 (18.30%) Azure
12 133 (17.64%) Linux
13 127 (16.84%) Python
14 119 (15.78%) SC Cleared
15 117 (15.52%) VMware
16 113 (14.99%) Systems Engineering
17 110 (14.59%) Social Skills
18 101 (13.40%) Validation
19 94 (12.47%) Active Directory
20 88 (11.67%) Windows Server
21 77 (10.21%) VB
22 74 (9.81%) Aerospace
23 72 (9.55%) Firewall
24 71 (9.42%) Manufacturing
25 68 (9.02%) HNC
26 67 (8.89%) AWS
27 66 (8.75%) VMware Infrastructure
28 65 (8.62%) IIS

Systems Engineer Skill Set
Co-occurring Skills and Capabilities by Category

The follow tables expand on the table above by listing co-occurrences grouped by category. The same employment type, locality and period is covered with up to 20 co-occurrences shown in each of the following categories:

Application Platforms
1 65 (8.62%) IIS
2 29 (3.85%) Confluence
3 14 (1.86%) SharePoint
4 12 (1.59%) MS Exchange
5 11 (1.46%) WinCC
6 7 (0.93%) OpenStack
7 5 (0.66%) Apache
8 2 (0.27%) JBoss
8 2 (0.27%) Tomcat
8 2 (0.27%) WebLogic
9 1 (0.13%) Exchange Server 2013
9 1 (0.13%) nginx
9 1 (0.13%) TPMS
9 1 (0.13%) WordPress
Applications
1 49 (6.50%) Simulink
2 34 (4.51%) Stateflow
3 20 (2.65%) Microsoft Office
4 8 (1.06%) Windchill
5 5 (0.66%) OrCAD
6 4 (0.53%) CANalyzer
6 4 (0.53%) Microsoft Excel
7 3 (0.40%) Microsoft PowerPoint
8 1 (0.13%) MS Visio
Business Applications
1 18 (2.39%) Endur
2 5 (0.66%) Sparx Enterprise Architect
3 2 (0.27%) Unit4 Business World
4 1 (0.13%) Remedy ITSM
Cloud Services
1 138 (18.30%) Azure
2 67 (8.89%) AWS
3 58 (7.69%) Microsoft 365
4 24 (3.18%) Entra ID
5 23 (3.05%) Cloud Computing
6 7 (0.93%) PaaS
6 7 (0.93%) Power Platform
7 6 (0.80%) Amazon EC2
7 6 (0.80%) IaaS
7 6 (0.80%) SaaS
8 5 (0.66%) Rubrik
9 4 (0.53%) Google Workspace
10 3 (0.40%) Azure DevOps
10 3 (0.40%) Azure Sentinel
10 3 (0.40%) Dynamics 365
10 3 (0.40%) GitHub
10 3 (0.40%) PowerApps
11 2 (0.27%) CloudBees
11 2 (0.27%) GCP
11 2 (0.27%) Serverless
Communications & Networking
1 72 (9.55%) Firewall
2 62 (8.22%) WAN
3 59 (7.82%) DNS
4 50 (6.63%) DHCP
5 40 (5.31%) TCP/IP
6 25 (3.32%) SNMP
7 19 (2.52%) LAN
8 18 (2.39%) HTTP
9 14 (1.86%) SAN
9 14 (1.86%) VPN
10 13 (1.72%) VLAN
11 11 (1.46%) Network Security
11 11 (1.46%) SD-WAN
11 11 (1.46%) Wireless
12 10 (1.33%) 5G
12 10 (1.33%) Internet
13 9 (1.19%) Ethernet
13 9 (1.19%) PBX
13 9 (1.19%) Wireshark
14 8 (1.06%) SSL
Database & Business Intelligence
1 55 (7.29%) SQL Server
2 30 (3.98%) NoSQL
3 19 (2.52%) Relational Database
4 18 (2.39%) RDBMS
5 16 (2.12%) PostgreSQL
6 15 (1.99%) MySQL
7 12 (1.59%) Amazon RDS
8 4 (0.53%) InfluxDB
9 3 (0.40%) MariaDB
9 3 (0.40%) Oracle Database
10 2 (0.27%) Data Warehouse
10 2 (0.27%) OLTP
11 1 (0.13%) Oracle Reports
11 1 (0.13%) Power BI
Development Applications
1 48 (6.37%) LabVIEW
2 39 (5.17%) JIRA
3 26 (3.45%) Jenkins
4 21 (2.79%) Rational DOORS
5 11 (1.46%) Artifactory
5 11 (1.46%) Atlassian Bamboo
5 11 (1.46%) Liquibase
6 9 (1.19%) Bitbucket
6 9 (1.19%) Git
7 8 (1.06%) AutoIt
7 8 (1.06%) eggPlant
7 8 (1.06%) JMeter
7 8 (1.06%) Selenium
7 8 (1.06%) SoapUI
7 8 (1.06%) TestLink
8 6 (0.80%) GitLab
9 4 (0.53%) Visual Studio
10 3 (0.40%) Rational Rhapsody
11 2 (0.27%) CircleCI
12 1 (0.13%) Rational Team Concert
General
1 110 (14.59%) Social Skills
2 74 (9.81%) Aerospace
3 71 (9.42%) Manufacturing
4 50 (6.63%) Finance
5 41 (5.44%) Analytical Skills
5 41 (5.44%) Automotive
6 36 (4.77%) Electronics
7 34 (4.51%) Military
8 33 (4.38%) Telecoms
9 25 (3.32%) Inclusion and Diversity
10 20 (2.65%) Games
11 17 (2.25%) Retail
12 16 (2.12%) Legal
13 14 (1.86%) Avionics
14 9 (1.19%) Aviation
14 9 (1.19%) Documentation Skills
14 9 (1.19%) Marketing
15 8 (1.06%) Law
15 8 (1.06%) Public Sector
16 7 (0.93%) Presentation Skills
Libraries, Frameworks & Software Standards
1 19 (2.52%) REST
2 16 (2.12%) Kafka
3 15 (1.99%) WebRTC
4 7 (0.93%) .NET
5 5 (0.66%) Elastic Stack
5 5 (0.66%) Web Services
6 4 (0.53%) JSON
6 4 (0.53%) LAMP
6 4 (0.53%) LAPP Stack
6 4 (0.53%) Middleware
6 4 (0.53%) Node.js
6 4 (0.53%) RabbitMQ
6 4 (0.53%) RESTful
6 4 (0.53%) XML
7 3 (0.40%) LDAP
8 2 (0.27%) LEMP Stack
8 2 (0.27%) Node-RED
8 2 (0.27%) OpenMP
8 2 (0.27%) Velocity
9 1 (0.13%) ASP.NET Web API
Miscellaneous
1 174 (23.08%) Management Information System
2 52 (6.90%) Arduino
2 52 (6.90%) Raspberry Pi
3 40 (5.31%) Clustering
4 39 (5.17%) Algorithms
4 39 (5.17%) Self-Motivation
5 37 (4.91%) Embedded Systems
6 35 (4.64%) Renewable Energy
7 33 (4.38%) Virtual Team
8 26 (3.45%) CMDB
9 24 (3.18%) SCADA
10 19 (2.52%) Public Cloud
11 18 (2.39%) Distributed Systems
11 18 (2.39%) Swaptions
12 17 (2.25%) Data Centre
13 14 (1.86%) Blackberry
14 13 (1.72%) PKI
15 12 (1.59%) FPGA
15 12 (1.59%) Onboarding
16 11 (1.46%) Enterprise Software
Operating Systems
1 148 (19.63%) Windows
2 133 (17.64%) Linux
3 88 (11.67%) Windows Server
4 23 (3.05%) Unix
4 23 (3.05%) Windows 10
5 22 (2.92%) Red Hat Enterprise Linux
6 16 (2.12%) Windows Server 2016
7 14 (1.86%) Solaris
8 13 (1.72%) Windows Server 2019
9 12 (1.59%) Mac OS
10 11 (1.46%) AIX
10 11 (1.46%) CentOS
10 11 (1.46%) Debian
10 11 (1.46%) Fedora
10 11 (1.46%) HPUX
11 10 (1.33%) Ubuntu
11 10 (1.33%) Windows Server 2012
12 6 (0.80%) Android
13 5 (0.66%) Apple iOS
14 4 (0.53%) Windows Server 2008
Processes & Methodologies
1 241 (31.96%) Agile
2 183 (24.27%) Problem-Solving
3 166 (22.02%) Asset Management
4 159 (21.09%) Compliance Management
5 113 (14.99%) Systems Engineering
6 101 (13.40%) Validation
7 64 (8.49%) High Availability
8 60 (7.96%) CI/CD
9 58 (7.69%) Prototyping
10 57 (7.56%) Configuration Management
11 56 (7.43%) Customer Requirements
12 53 (7.03%) SDLC
13 52 (6.90%) Design for Manufacturing
14 51 (6.76%) Software Engineering
15 50 (6.63%) Verification and Validation
16 45 (5.97%) Software Testing
17 44 (5.84%) DevOps
18 38 (5.04%) Change Management
19 36 (4.77%) Hardware-in-the-Loop
20 34 (4.51%) Rapid Prototyping
Programming Languages
1 303 (40.19%) SQL
2 159 (21.09%) PL/SQL
3 127 (16.84%) Python
4 77 (10.21%) VB
5 58 (7.69%) PowerShell
6 55 (7.29%) MATLAB
7 54 (7.16%) Java
8 46 (6.10%) Bash
9 34 (4.51%) C++
10 27 (3.58%) C
11 16 (2.12%) C#
12 9 (1.19%) Shell Script
13 8 (1.06%) Perl
13 8 (1.06%) PHP
14 4 (0.53%) Go
15 3 (0.40%) R
16 2 (0.27%) COBOL
16 2 (0.27%) REXX
16 2 (0.27%) Ruby
16 2 (0.27%) VBA
Qualifications
1 181 (24.01%) Security Cleared
2 145 (19.23%) Degree
3 119 (15.78%) SC Cleared
4 68 (9.02%) HNC
5 31 (4.11%) DV Cleared
6 21 (2.79%) HND
7 18 (2.39%) Cisco Certification
8 16 (2.12%) CCNA
9 14 (1.86%) CompTIA Security+
10 11 (1.46%) Computer Science Degree
11 10 (1.33%) Microsoft Certification
12 9 (1.19%) MCSA
13 8 (1.06%) BPSS Clearance
14 7 (0.93%) Master's Degree
15 6 (0.80%) AWS Certification
16 5 (0.66%) Chartered Engineer
17 4 (0.53%) AWS Certified Solutions Architect
17 4 (0.53%) DBS Check
17 4 (0.53%) MCSE
17 4 (0.53%) Six Sigma Green Belt
Quality Assurance & Compliance
1 19 (2.52%) QA
2 15 (1.99%) ISO/IEC 15288
3 12 (1.59%) ARP4754
4 10 (1.33%) Automotive SPICE
5 9 (1.19%) PMO
6 8 (1.06%) IEC 61508
6 8 (1.06%) SLA
7 7 (0.93%) ISO 26262
8 6 (0.80%) ARP4761
9 3 (0.40%) Def Stans
10 2 (0.27%) Accessibility
10 2 (0.27%) AUTOSAR
10 2 (0.27%) Cyber Essentials
10 2 (0.27%) HAZOP
10 2 (0.27%) IEC 61131
10 2 (0.27%) ISO/IEC 27001
11 1 (0.13%) COBIT
11 1 (0.13%) GDPR
11 1 (0.13%) NCSC
11 1 (0.13%) NIST
System Software
1 94 (12.47%) Active Directory
2 66 (8.75%) VMware Infrastructure
3 30 (3.98%) Docker
4 27 (3.58%) Hyper-V
5 25 (3.32%) VMware NSX
6 15 (1.99%) VMware ESXi
7 13 (1.72%) Firmware
8 7 (0.93%) Virtual Machines
9 6 (0.80%) vSphere
10 5 (0.66%) Virtual Desktop
11 3 (0.40%) Citrix Hypervisor
11 3 (0.40%) Embedded Firmware
12 2 (0.27%) Virtual Servers
13 1 (0.13%) BitLocker
13 1 (0.13%) KVM
13 1 (0.13%) QEMU
13 1 (0.13%) Shibboleth
13 1 (0.13%) Slurm Workload Manager
13 1 (0.13%) XenApp
13 1 (0.13%) XenDesktop
Systems Management
1 34 (4.51%) Ansible
2 30 (3.98%) SCOM
3 24 (3.18%) Terraform
4 23 (3.05%) Microsoft Intune
5 20 (2.65%) Kubernetes
6 18 (2.39%) SCCM
7 12 (1.59%) Functional Safety
8 6 (0.80%) Failover Clustering
9 5 (0.66%) Active Directory Federation Services
10 4 (0.53%) Puppet
10 4 (0.53%) Single Sign-On
11 3 (0.40%) Progress Chef
11 3 (0.40%) Wonderware InTouch
12 2 (0.27%) Nagios
12 2 (0.27%) Red Hat Spacewalk
12 2 (0.27%) vCenter Server
13 1 (0.13%) Backup Exec
13 1 (0.13%) FortiGate
13 1 (0.13%) Norton AntiVirus
13 1 (0.13%) SCVMM
Vendors
1 163 (21.62%) Microsoft
2 159 (21.09%) NEC
3 117 (15.52%) VMware
4 30 (3.98%) Oracle
5 27 (3.58%) Cisco
6 26 (3.45%) Red Hat
7 25 (3.32%) Dynatrace
8 18 (2.39%) OpenLink
8 18 (2.39%) Siemens
8 18 (2.39%) Sybase
8 18 (2.39%) TIBCO
9 14 (1.86%) Citrix
9 14 (1.86%) MobileIron
9 14 (1.86%) Samsung
10 13 (1.72%) Dell
11 12 (1.59%) Atlassian
11 12 (1.59%) Palo Alto
12 11 (1.46%) CyberArk
12 11 (1.46%) Rockwell
12 11 (1.46%) Splunk