IaaS Contract Job Trends in the City of London

Infrastructure as a Service (IaaS)
Central London > City of London

The table below provides summary statistics and contractor rates for jobs advertised in the City of London requiring IaaS skills. It covers contract job vacancies from the 6 months leading up to 8 November 2025, with comparisons to the same periods in the previous two years.

6 months to
8 Nov 2025
Same period 2024 Same period 2023
Rank 105 102 106
Rank change year-on-year -3 +4 +48
Contract jobs citing IaaS 19 21 39
As % of all contract jobs in the City of London 1.09% 0.99% 1.39%
As % of the Cloud Services category 2.62% 2.52% 3.43%
Number of daily rates quoted 13 16 30
10th Percentile £454 £406 £438
25th Percentile £495 £504 £513
Median daily rate (50th Percentile) £675 £560 £631
Median % change year-on-year +20.54% -11.29% +6.54%
75th Percentile £775 £681 £725
90th Percentile £830 £767 £875
Central London median daily rate £675 £575 £625
% change year-on-year +17.39% -8.00% +5.93%

All Cloud Skills
City of London

IaaS falls under the Cloud Services category. For comparison with the information above, the following table provides summary statistics for all contract job vacancies requiring cloud computing skills in the City of London.

Contract vacancies with a requirement for cloud computing skills 725 834 1,138
As % of all contract IT jobs advertised in the City of London 41.67% 39.40% 40.64%
Number of daily rates quoted 536 537 788
10th Percentile £351 £400 £352
25th Percentile £425 £475 £450
Median daily rate (50th Percentile) £550 £575 £550
Median % change year-on-year -4.35% +4.55% -4.35%
75th Percentile £668 £675 £679
90th Percentile £750 £760 £775
Central London median daily rate £550 £575 £550
% change year-on-year -4.35% +4.55% -4.35%
Number of hourly rates quoted 9 2 10
10th Percentile £22.30 £32.05 £16.53
25th Percentile £26.75 £39.63 £17.00
Median hourly rate £34.00 £56.00 £20.75
Median % change year-on-year -39.29% +169.88% +1.22%
75th Percentile £56.75 £76.13 £46.06
90th Percentile £70.21 £85.95 £54.63
Central London median hourly rate £28.50 £35.00 £19.00
% change year-on-year -18.57% +84.21% -7.32%

IaaS
Job Vacancy Trend in the City of London

Historical trend showing the proportion of contract IT job postings citing IaaS relative to all contract IT jobs advertised in the City of London.
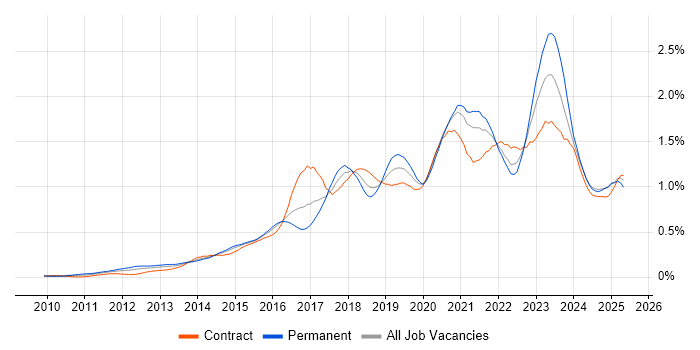
IaaS job vacancy trend in the City of London

IaaS
Daily Rate Trend in the City of London

Contractor daily rate distribution trend for jobs in the City of London citing IaaS.

Contractor daily rate distribution trend for jobs in the City of London citing IaaS

IaaS
Daily Rate Histogram in the City of London

Daily rate distribution for jobs citing IaaS in the City of London over the 6 months to 8 November 2025.

Daily rate histogram for IaaS in the City of London

IaaS
Hourly Rate Trend in the City of London

Contractor hourly rate distribution trend for jobs in the City of London citing IaaS.

Contractor hourly rate distribution trend for jobs in the City of London citing IaaS

IaaS
Co-Occurring Skills & Capabilities in the City of London by Category

The following tables expand on the one above by listing co-occurrences grouped by category. They cover the same employment type, locality and period, with up to 20 co-occurrences shown in each category:

Application Platforms
1 1 (5.26%) CICS
1 1 (5.26%) Microsoft Exchange
Business Applications
1 1 (5.26%) Oracle Assets
1 1 (5.26%) Oracle Cash Management
1 1 (5.26%) Oracle EBS
1 1 (5.26%) Oracle Procure-to-Pay
Cloud Services
1 17 (89.47%) Azure
2 12 (63.16%) PaaS
2 12 (63.16%) SaaS
3 6 (31.58%) Microsoft 365
4 4 (21.05%) Azure DevOps
4 4 (21.05%) GCP
5 2 (10.53%) Azure Monitor
5 2 (10.53%) Boomi
5 2 (10.53%) Cloud Computing
5 2 (10.53%) Entra ID
5 2 (10.53%) GitHub
5 2 (10.53%) GitHub Actions
5 2 (10.53%) iPaaS
5 2 (10.53%) Mimecast
6 1 (5.26%) Amazon EC2
6 1 (5.26%) Amazon S3
6 1 (5.26%) AWS
6 1 (5.26%) Azure AKS
6 1 (5.26%) Azure Logic Apps
6 1 (5.26%) Nutanix
Communications & Networking
1 3 (15.79%) Firewall
2 2 (10.53%) Network Security
3 1 (5.26%) DNS
3 1 (5.26%) MPLS
3 1 (5.26%) NAS
Database & Business Intelligence
1 4 (21.05%) SQL Server
2 2 (10.53%) Azure SQL Database
3 1 (5.26%) Amazon RDS
3 1 (5.26%) Power BI
3 1 (5.26%) Relational Database
3 1 (5.26%) SQL Server Reporting Services
General
1 10 (52.63%) Finance
2 4 (21.05%) Analytical Skills
2 4 (21.05%) Banking
2 4 (21.05%) Social Skills
3 2 (10.53%) Financial Institution
3 2 (10.53%) Influencing Skills
3 2 (10.53%) Investment Banking
3 2 (10.53%) Legal
3 2 (10.53%) Marketing
4 1 (5.26%) General Ledger
4 1 (5.26%) International Banking
4 1 (5.26%) Presentation Skills
Job Titles
1 8 (42.11%) Architect
2 3 (15.79%) Azure Architect
2 3 (15.79%) Solutions Architect
3 2 (10.53%) Cloud Architect
3 2 (10.53%) DevOps Engineer
3 2 (10.53%) Enterprise Architect
3 2 (10.53%) Infrastructure Engineer
3 2 (10.53%) Migration Architect
3 2 (10.53%) Service Manager
4 1 (5.26%) Cloud Engineer
4 1 (5.26%) Head of Technology
4 1 (5.26%) Integration Engineer
4 1 (5.26%) Microsoft 365 Architect
4 1 (5.26%) Microsoft Solutions Architect
4 1 (5.26%) Platform Manager
4 1 (5.26%) Salesforce Architect
4 1 (5.26%) Senior Architect
4 1 (5.26%) Senior Enterprise Architect
4 1 (5.26%) ServiceNow Developer
4 1 (5.26%) Site Engineer
Libraries, Frameworks & Software Standards
1 1 (5.26%) .NET
1 1 (5.26%) .NET Core
1 1 (5.26%) ADO
1 1 (5.26%) ARM Templates
1 1 (5.26%) Middleware
1 1 (5.26%) Oracle Fusion
Miscellaneous
1 6 (31.58%) Cloud Native
2 3 (15.79%) Hybrid Cloud
3 2 (10.53%) Private Cloud
4 1 (5.26%) Data Centre
4 1 (5.26%) Mainframe
4 1 (5.26%) VSAM
Operating Systems
1 4 (21.05%) Windows
2 3 (15.79%) Linux
2 3 (15.79%) Windows Server
3 1 (5.26%) AIX
3 1 (5.26%) Solaris
Processes & Methodologies
1 6 (31.58%) Migration
1 6 (31.58%) Stakeholder Engagement
2 5 (26.32%) Change Management
2 5 (26.32%) Cloud Security
2 5 (26.32%) Disaster Recovery
2 5 (26.32%) Problem-Solving
3 4 (21.05%) DevOps
3 4 (21.05%) Infrastructure as Code
3 4 (21.05%) Infrastructure Engineering
4 3 (15.79%) Cloud Operations
4 3 (15.79%) Cost Optimisation
4 3 (15.79%) ITIL
4 3 (15.79%) Project Delivery
4 3 (15.79%) Security Architecture
5 2 (10.53%) Business Strategy
5 2 (10.53%) CI/CD
5 2 (10.53%) Data Loss Prevention
5 2 (10.53%) Infrastructure Automation
5 2 (10.53%) Strategic Thinking
5 2 (10.53%) Translating Business Requirements
Programming Languages
1 3 (15.79%) Bicep
1 3 (15.79%) SQL
2 2 (10.53%) PowerShell
2 2 (10.53%) Python
3 1 (5.26%) Bash
3 1 (5.26%) C#
3 1 (5.26%) COBOL
3 1 (5.26%) Kusto Query Language
3 1 (5.26%) PL/SQL
Qualifications
1 6 (31.58%) Azure Certification
2 4 (21.05%) Microsoft Certification
3 3 (15.79%) SC Cleared
3 3 (15.79%) Security Cleared
4 2 (10.53%) ITIL Certification
4 2 (10.53%) MCITP
5 1 (5.26%) Degree
Quality Assurance & Compliance
1 5 (26.32%) ISO/IEC 27001
2 2 (10.53%) GDPR
2 2 (10.53%) Sarbanes-Oxley
2 2 (10.53%) SLA
2 2 (10.53%) SOC 2
3 1 (5.26%) Cyber Essentials
3 1 (5.26%) GAAP
3 1 (5.26%) GRC
3 1 (5.26%) IFRS
3 1 (5.26%) ISO/IEC 27005
3 1 (5.26%) NCSC
3 1 (5.26%) NIST
3 1 (5.26%) QA
System Software
1 3 (15.79%) Active Directory
2 2 (10.53%) Docker
2 2 (10.53%) VMware Infrastructure
3 1 (5.26%) vSphere
Systems Management
1 6 (31.58%) Terraform
2 5 (26.32%) Microsoft Intune
3 3 (15.79%) Kubernetes
4 2 (10.53%) SCOM
5 1 (5.26%) Grafana
5 1 (5.26%) Istio
5 1 (5.26%) Prometheus
Vendors
1 12 (63.16%) Microsoft
2 5 (26.32%) Google
3 3 (15.79%) Oracle
3 3 (15.79%) VMware
4 2 (10.53%) Cisco
4 2 (10.53%) HP
4 2 (10.53%) Palo Alto
4 2 (10.53%) Salesforce
4 2 (10.53%) Salesforce Marketing Cloud
4 2 (10.53%) SAP
5 1 (5.26%) LogRhythm
5 1 (5.26%) NetApp
5 1 (5.26%) ServiceNow