Database Migration Contracts with Work from Home Options

Database Migration
UK > Work from Home

The table below provides summary statistics for contract job vacancies with an option to work from home (WFH) and a requirement for Database Migration skills. Included is a benchmarking guide to the contractor rates offered in vacancies that have cited Database Migration over the 6 months to 5 May 2024 with a comparison to the same period in the previous 2 years.

6 months to
5 May 2024
Same period 2023 Same period 2022
Rank 311 434 560
Rank change year-on-year +123 +126 -102
Contract jobs citing Database Migration 37 42 62
As % of all contract jobs with a WFH option 0.24% 0.16% 0.14%
As % of the Processes & Methodologies category 0.28% 0.18% 0.15%
Number of daily rates quoted 20 27 40
10th Percentile - £400 £411
25th Percentile £413 £437 £467
Median daily rate (50th Percentile) £494 £515 £530
Median % change year-on-year -4.13% -2.83% +24.71%
75th Percentile £638 £638 £589
90th Percentile £688 £730 £629
UK median daily rate £475 £550 £535
% change year-on-year -13.64% +2.80% +25.88%
Number of hourly rates quoted 0 1 0
Median hourly rate - £25.00 -
UK median hourly rate £80.00 £26.25 -
% change year-on-year +204.76% - -

All Process and Methodology Skills
Work from Home

Database Migration is in the Processes and Methodologies category. The following table is for comparison with the above and provides summary statistics for all contract job vacancies with a WFH option and a requirement for process or methodology skills.

Contract vacancies with a requirement for process or methodology skills 13,319 22,924 40,623
As % of all contract jobs with a WFH option 87.90% 89.76% 91.11%
Number of daily rates quoted 8,917 16,193 29,494
10th Percentile £325 £363 £362
25th Percentile £425 £450 £431
Median daily rate (50th Percentile) £525 £540 £525
Median % change year-on-year -2.78% +2.86% +8.25%
75th Percentile £638 £650 £630
90th Percentile £750 £750 £725
UK median daily rate £525 £550 £530
% change year-on-year -4.55% +3.77% +8.72%
Number of hourly rates quoted 575 527 541
10th Percentile £15.17 £18.67 £13.75
25th Percentile £24.63 £30.00 £20.00
Median hourly rate £42.50 £55.00 £35.00
Median % change year-on-year -22.73% +57.14% +40.00%
75th Percentile £60.00 £68.75 £55.25
90th Percentile £75.15 £80.25 £67.50
UK median hourly rate £35.95 £35.80 £25.00
% change year-on-year +0.42% +43.20% +2.04%

Database Migration
Trend for Jobs with a WFH Option

Job vacancies with a work from home option citing Database Migration as a proportion of all IT jobs advertised.
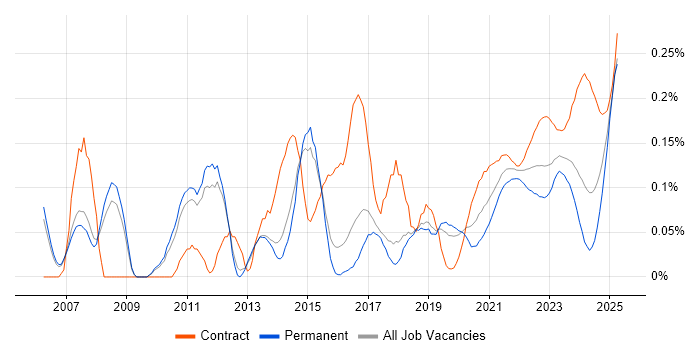
Database Migration trend for jobs with a WFH option

Database Migration
Daily Rate Trend for Jobs with a WFH Option

3-month moving average daily rate quoted in job vacancies with a work from home option citing Database Migration.

Database Migration daily rate for jobs with a WFH option

Database Migration
Daily Rate Histogram for Jobs with a WFH Option

Daily rate distribution for jobs with a work from home option citing Database Migration over the 6 months to 5 May 2024.

Database Migration daily rate histogram for jobs with a WFH option

Database Migration
Co-occurring Skills and Capabilities with WFH Options by Category

The follow tables expand on the table above by listing co-occurrences grouped by category. The same employment type, locality and period is covered with up to 20 co-occurrences shown in each of the following categories:

Application Platforms
1 1 (2.70%) Apache Solr
1 1 (2.70%) WebLogic
Cloud Services
1 12 (32.43%) AWS
2 6 (16.22%) Azure
3 4 (10.81%) GCP
4 3 (8.11%) Amazon ECR
4 3 (8.11%) Amazon MSK
5 2 (5.41%) OCI
6 1 (2.70%) Amazon CloudWatch
6 1 (2.70%) Amazon ECS
6 1 (2.70%) AWS CloudFormation
6 1 (2.70%) AWS Lambda
6 1 (2.70%) Entra ID
6 1 (2.70%) Microsoft 365
6 1 (2.70%) SaaS
6 1 (2.70%) Serverless
Communications & Networking
1 4 (10.81%) NAS
1 4 (10.81%) SAN
2 3 (8.11%) DNS
2 3 (8.11%) VPN
Database & Business Intelligence
1 9 (24.32%) Oracle Database
1 9 (24.32%) PostgreSQL
2 5 (13.51%) DB2
3 4 (10.81%) Elasticsearch
3 4 (10.81%) Relational Database
3 4 (10.81%) SQL Server
3 4 (10.81%) SQL Server Integration Services
3 4 (10.81%) SQL Server Reporting Services
4 3 (8.11%) Amazon QuickSight
4 3 (8.11%) MariaDB
4 3 (8.11%) MySQL
5 2 (5.41%) Amazon RDS
5 2 (5.41%) BusinessObjects
5 2 (5.41%) GIS
5 2 (5.41%) MongoDB
5 2 (5.41%) NoSQL
6 1 (2.70%) Couchbase
6 1 (2.70%) NewSQL
6 1 (2.70%) Oracle Exadata
6 1 (2.70%) SQL Server Analysis Services
Development Applications
1 3 (8.11%) Cypress.io
1 3 (8.11%) Snyk
2 1 (2.70%) Jenkins
General
1 5 (13.51%) Social Skills
2 4 (10.81%) Finance
2 4 (10.81%) Retail
3 3 (8.11%) Banking
3 3 (8.11%) Documentation Skills
3 3 (8.11%) Retail Banking
4 1 (2.70%) Advertising
4 1 (2.70%) Analytical Skills
4 1 (2.70%) Public Sector
Job Titles
1 7 (18.92%) Architect
1 7 (18.92%) DBA
1 7 (18.92%) Developer
2 4 (10.81%) Oracle Architect
2 4 (10.81%) Oracle DBA
2 4 (10.81%) Programme Manager
2 4 (10.81%) Storage Engineer
3 3 (8.11%) DevOps Engineer
3 3 (8.11%) Migration Manager
3 3 (8.11%) SQL Developer
4 2 (5.41%) Administrator
4 2 (5.41%) AWS Architect
4 2 (5.41%) Backup Engineer
4 2 (5.41%) Data Architect
4 2 (5.41%) Database Engineer
4 2 (5.41%) Senior
4 2 (5.41%) Senior Database Engineer
4 2 (5.41%) Storage and Backup Engineer
5 1 (2.70%) Python Developer
5 1 (2.70%) Wintel Engineer
Libraries, Frameworks & Software Standards
1 3 (8.11%) .NET
1 3 (8.11%) GraphQL
1 3 (8.11%) Kafka
2 1 (2.70%) .NET Framework
2 1 (2.70%) AngularJS
2 1 (2.70%) AWS CDK
2 1 (2.70%) J2EE
2 1 (2.70%) Oracle GoldenGate
2 1 (2.70%) Spring
2 1 (2.70%) Spring Boot
Miscellaneous
1 4 (10.81%) Replication
2 3 (8.11%) Cloud Native
2 3 (8.11%) Greenfield Project
3 2 (5.41%) Hybrid Cloud
4 1 (2.70%) Enterprise Software
4 1 (2.70%) IBM Mainframe
4 1 (2.70%) Legacy Systems
4 1 (2.70%) Mainframe
4 1 (2.70%) PMI
Operating Systems
1 5 (13.51%) Linux
2 4 (10.81%) Oracle Linux
2 4 (10.81%) Solaris
2 4 (10.81%) VMS
3 1 (2.70%) Windows
3 1 (2.70%) Windows 10
3 1 (2.70%) Windows Server
3 1 (2.70%) Windows Server 2012
3 1 (2.70%) Windows Server 2016
3 1 (2.70%) Windows Server 2019
Processes & Methodologies
1 30 (81.08%) Migration
2 9 (24.32%) DevOps
3 6 (16.22%) Problem-Solving
4 5 (13.51%) Data Migration
5 4 (10.81%) Agile
5 4 (10.81%) Database Security
5 4 (10.81%) Full Stack Development
6 3 (8.11%) Analytics
6 3 (8.11%) Customer Experience
6 3 (8.11%) Data Management
6 3 (8.11%) Data Modelling
6 3 (8.11%) Data Reconciliation
6 3 (8.11%) Data Science
6 3 (8.11%) Kalman Filter
6 3 (8.11%) RBAC
6 3 (8.11%) Re-Platforming
6 3 (8.11%) Roadmaps
6 3 (8.11%) Site Reliability Engineering
6 3 (8.11%) Software Engineering
6 3 (8.11%) Task Automation
Programming Languages
1 16 (43.24%) SQL
2 7 (18.92%) Java
3 3 (8.11%) Go
3 3 (8.11%) PHP
3 3 (8.11%) Python
4 1 (2.70%) Bash
4 1 (2.70%) PowerShell
4 1 (2.70%) TypeScript
Qualifications
1 2 (5.41%) AWS Certification
2 1 (2.70%) Computer Science Degree
2 1 (2.70%) Degree
2 1 (2.70%) ITIL Certification
2 1 (2.70%) PMI Certification
2 1 (2.70%) PMP
2 1 (2.70%) Security Cleared
2 1 (2.70%) TOGAF Certification
System Software
1 8 (21.62%) VMware Infrastructure
2 4 (10.81%) KVM
3 1 (2.70%) Active Directory
3 1 (2.70%) Docker
Systems Management
1 6 (16.22%) Kubernetes
2 4 (10.81%) Avamar
2 4 (10.81%) Terraform
3 3 (8.11%) Ansible
3 3 (8.11%) Grafana
3 3 (8.11%) Prometheus
4 1 (2.70%) Data Guard
4 1 (2.70%) Istio
4 1 (2.70%) Single Sign-On
Vendors
1 12 (32.43%) Oracle
2 8 (21.62%) VMware
3 6 (16.22%) Microsoft
4 4 (10.81%) Dell
4 4 (10.81%) EMC
4 4 (10.81%) Google
5 3 (8.11%) IBM
5 3 (8.11%) SAP
6 2 (5.41%) ESRI
7 1 (2.70%) Facebook
7 1 (2.70%) Instagram