Data Migration Contracts with Hybrid/Remote/WFH Options

Data Migration
UK > Work from Home

The table below provides summary statistics for remote or hybrid contract work requiring Data Migration skills. It includes a benchmarking guide to the contractor rates offered in vacancies that cited Data Migration over the 6 months leading up to 30 April 2025, comparing them to the same period in the previous two years.

6 months to
30 Apr 2025
Same period 2024 Same period 2023
Rank 78 75 105
Rank change year-on-year -3 +30 +20
Contract jobs citing Data Migration 309 432 582
As % of all contract jobs with a WFH option 3.12% 2.81% 2.25%
As % of the Processes & Methodologies category 3.42% 3.20% 2.51%
Number of daily rates quoted 210 299 411
10th Percentile £413 £412 £399
25th Percentile £463 £482 £450
Median daily rate (50th Percentile) £534 £550 £515
Median % change year-on-year -2.95% +6.80% -1.90%
75th Percentile £625 £688 £600
90th Percentile £688 £713 £701
UK median daily rate £525 £550 £525
% change year-on-year -4.55% +4.76% -
Number of hourly rates quoted 6 2 4
10th Percentile £26.21 - -
25th Percentile £41.91 £83.50 £17.50
Median hourly rate £66.25 £85.00 £19.50
Median % change year-on-year -22.06% +335.90% -56.98%
75th Percentile £83.10 £86.50 £24.13
90th Percentile £87.05 - £30.65
UK median hourly rate £70.00 £75.00 £21.25
% change year-on-year -6.67% +252.94% +6.25%

All Process and Methodology Skills
Work from Home

Data Migration falls under the Processes and Methodologies category. For comparison with the information above, the following table provides summary statistics for all contract job vacancies with remote or hybrid options requiring process or methodology skills.

Contract vacancies with a requirement for process or methodology skills 9,023 13,505 23,232
As % of all contract jobs with a WFH option 91.03% 87.83% 89.84%
Number of daily rates quoted 6,195 9,015 16,421
10th Percentile £340 £325 £363
25th Percentile £419 £425 £450
Median daily rate (50th Percentile) £525 £525 £540
Median % change year-on-year - -2.78% +2.86%
75th Percentile £638 £638 £650
90th Percentile £763 £750 £750
UK median daily rate £521 £525 £550
% change year-on-year -0.86% -4.55% +4.76%
Number of hourly rates quoted 225 573 532
10th Percentile £14.20 £15.17 £19.00
25th Percentile £19.75 £24.25 £30.54
Median hourly rate £40.00 £42.50 £55.00
Median % change year-on-year -5.88% -22.73% +57.14%
75th Percentile £67.50 £60.00 £68.75
90th Percentile £75.00 £75.25 £80.23
UK median hourly rate £29.00 £35.50 £37.30
% change year-on-year -18.31% -4.83% +49.20%

Data Migration
Trend for Jobs with a WFH Option

Job vacancies with remote working options citing Data Migration as a proportion of all IT jobs advertised.
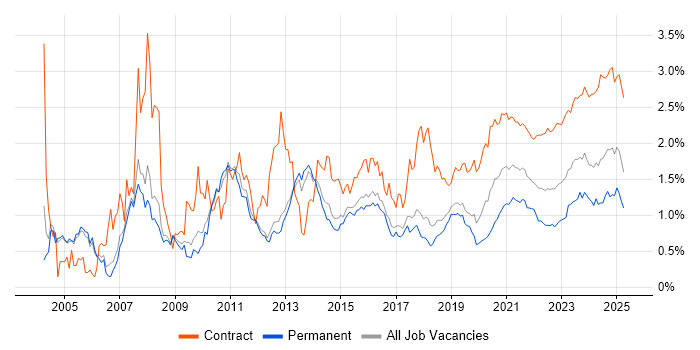
Data Migration trend for jobs with Hybrid/Remote/WFH options

Data Migration
Daily Rate Trend for Jobs with a WFH Option

3-month moving average daily rate quoted in job vacancies with remote working options citing Data Migration.

Data Migration daily rate for jobs with a WFH option

Data Migration
Daily Rate Histogram for Jobs with a WFH Option

Daily rate distribution for jobs with remote working options citing Data Migration over the 6 months to 30 April 2025.

Data Migration daily rate histogram for jobs with a WFH option

Data Migration
Hourly Rate Trend for Jobs with a WFH Option

3-month moving average hourly rate quoted in job vacancies with remote working options citing Data Migration.

Data Migration hourly rate for jobs with a WFH option

Data Migration
Hourly Rate Histogram for Jobs with a WFH Option

Hourly rate distribution for jobs with remote working options citing Data Migration over the 6 months to 30 April 2025.

Data Migration hourly rate histogram for jobs with a WFH option

Data Migration
Co-occurring Skills and Capabilities with WFH Options by Category

The follow tables expand on the table above by listing co-occurrences grouped by category. The same employment type, locality and period is covered with up to 20 co-occurrences shown in each of the following categories:

Application Platforms
1 14 (4.53%) Confluence
2 9 (2.91%) SharePoint
3 4 (1.29%) Apache Spark
4 3 (0.97%) CMS
4 3 (0.97%) PowerExchange
5 2 (0.65%) IIS
5 2 (0.65%) SAS
6 1 (0.32%) Apache
6 1 (0.32%) Apache Airflow
6 1 (0.32%) ArcGIS
6 1 (0.32%) Drupal
6 1 (0.32%) GeoServer
6 1 (0.32%) IBM Notes
6 1 (0.32%) nginx
Applications
1 18 (5.83%) Microsoft Excel
2 5 (1.62%) MS Visio
3 2 (0.65%) Microsoft PowerPoint
3 2 (0.65%) Microsoft Project
4 1 (0.32%) AutoCAD
4 1 (0.32%) Microsoft Office
4 1 (0.32%) PTC Creo
4 1 (0.32%) Siemens NX
4 1 (0.32%) Trello
Business Applications
1 20 (6.47%) SAP S/4HANA
2 12 (3.88%) Dynamics CRM
3 11 (3.56%) Oracle EBS
4 8 (2.59%) SAP MDG
5 5 (1.62%) Infor LN
6 4 (1.29%) SAP EHS
7 3 (0.97%) Dynamics AX
7 3 (0.97%) Oracle ERP
7 3 (0.97%) Oracle Procure-to-Pay
7 3 (0.97%) SAP HR
7 3 (0.97%) SAP Oil and Gas
8 2 (0.65%) Maximo
8 2 (0.65%) Oracle E-Business Tax
8 2 (0.65%) Oracle Financials
8 2 (0.65%) SAP IBP
9 1 (0.32%) Distributed Ledger
9 1 (0.32%) Salesforce CRM
9 1 (0.32%) SAP CAR
9 1 (0.32%) Sparx Enterprise Architect
9 1 (0.32%) UltiPro
Cloud Services
1 49 (15.86%) Azure
2 45 (14.56%) AWS
3 30 (9.71%) Power Platform
4 29 (9.39%) Dynamics 365
5 14 (4.53%) GCP
6 13 (4.21%) Amazon S3
7 12 (3.88%) Serverless
8 11 (3.56%) AWS Lambda
8 11 (3.56%) Azure DevOps
8 11 (3.56%) Microsoft 365
9 9 (2.91%) Power Automate
9 9 (2.91%) PowerApps
10 8 (2.59%) AWS CloudFormation
11 7 (2.27%) Azure Data Factory
12 6 (1.94%) OCI
12 6 (1.94%) SaaS
12 6 (1.94%) SuccessFactors
13 5 (1.62%) Snowflake
14 4 (1.29%) AWS Step Functions
14 4 (1.29%) WhatsApp
Communications & Networking
1 3 (0.97%) Diameter Protocol
1 3 (0.97%) GGSN
1 3 (0.97%) SS7
2 1 (0.32%) Firewall
2 1 (0.32%) LAN
2 1 (0.32%) SSL
2 1 (0.32%) WAN
2 1 (0.32%) X.25
Database & Business Intelligence
1 26 (8.41%) Oracle Database
2 24 (7.77%) Data Warehouse
3 17 (5.50%) PostgreSQL
3 17 (5.50%) SQL Server
4 16 (5.18%) Power BI
5 11 (3.56%) Amazon RDS
6 8 (2.59%) Big Data
6 8 (2.59%) Data Lake
6 8 (2.59%) Oracle Reports
7 7 (2.27%) MySQL
7 7 (2.27%) SQL Server Integration Services
8 6 (1.94%) Oracle Database 11g
8 6 (1.94%) SAP Data Services
9 5 (1.62%) MS Access
10 4 (1.29%) Amazon Aurora
10 4 (1.29%) Amazon Redshift
10 4 (1.29%) Tableau
11 3 (0.97%) Amazon Athena
11 3 (0.97%) Metadata
11 3 (0.97%) Relational Database
Development Applications
1 12 (3.88%) JIRA
2 11 (3.56%) GitLab
3 5 (1.62%) Jenkins
4 3 (0.97%) REST Assured
5 2 (0.65%) ERwin
5 2 (0.65%) LSMW
6 1 (0.32%) Cucumber
6 1 (0.32%) DBeaver
6 1 (0.32%) Flyway
6 1 (0.32%) Hudson
6 1 (0.32%) Liquibase
6 1 (0.32%) SpecFlow
6 1 (0.32%) Subversion
6 1 (0.32%) Team Foundation Server
6 1 (0.32%) Visual Studio
General
1 87 (28.16%) Social Skills
2 84 (27.18%) Finance
3 54 (17.48%) Analytical Skills
4 22 (7.12%) Public Sector
5 21 (6.80%) Banking
6 20 (6.47%) Manufacturing
7 14 (4.53%) Retail
8 8 (2.59%) Presentation Skills
9 5 (1.62%) Inclusion and Diversity
9 5 (1.62%) Influencing Skills
9 5 (1.62%) Marketing
10 4 (1.29%) Billing
10 4 (1.29%) General Ledger
10 4 (1.29%) Legal
10 4 (1.29%) Pharmaceutical
10 4 (1.29%) Telecoms
11 3 (0.97%) Automotive
11 3 (0.97%) Documentation Skills
11 3 (0.97%) Local Government
11 3 (0.97%) Military
Job Titles
1 79 (25.57%) Consultant
2 50 (16.18%) Analyst
3 37 (11.97%) Architect
4 31 (10.03%) Lead
5 28 (9.06%) Data Engineer
6 24 (7.77%) Data Analyst
7 22 (7.12%) Developer
7 22 (7.12%) Project Manager
8 20 (6.47%) Data Consultant
9 17 (5.50%) Pensions Analyst
10 16 (5.18%) Data Migration Consultant
10 16 (5.18%) Migration Consultant
11 15 (4.85%) SAP Consultant
12 13 (4.21%) Mainframe Consultant
12 13 (4.21%) Storage Consultant
13 12 (3.88%) Migration Engineer
14 11 (3.56%) Business Analyst
15 10 (3.24%) Data Architect
15 10 (3.24%) Dynamics 365 Consultant
15 10 (3.24%) Functional Consultant
Libraries, Frameworks & Software Standards
1 14 (4.53%) REST
2 6 (1.94%) Lightning Web Components
2 6 (1.94%) SOAP
2 6 (1.94%) Visualforce
3 5 (1.62%) Middleware
3 5 (1.62%) Spring
3 5 (1.62%) Spring Boot
3 5 (1.62%) XML
4 4 (1.29%) AWS CDK
4 4 (1.29%) Gherkin
5 3 (0.97%) Elastic Stack
5 3 (0.97%) GWT
5 3 (0.97%) JWT
5 3 (0.97%) OAuth
5 3 (0.97%) Oracle Fusion
5 3 (0.97%) PostGIS
5 3 (0.97%) PySpark
5 3 (0.97%) Servlets
5 3 (0.97%) Spring Security
5 3 (0.97%) Web Services
Miscellaneous
1 25 (8.09%) Legacy Systems
2 14 (4.53%) Mainframe
3 10 (3.24%) Data Structures
4 7 (2.27%) Data Centre
5 6 (1.94%) Management Information System
5 6 (1.94%) Product Ownership
6 4 (1.29%) Life Science
7 3 (0.97%) FMCG
7 3 (0.97%) Onboarding
7 3 (0.97%) Reference Data
7 3 (0.97%) Renewable Energy
7 3 (0.97%) Self-Motivation
7 3 (0.97%) Virtual Team
8 2 (0.65%) Cloud Native
8 2 (0.65%) Enterprise Software
8 2 (0.65%) Hybrid Cloud
8 2 (0.65%) Legacy Applications
8 2 (0.65%) NHS
8 2 (0.65%) Private Cloud
8 2 (0.65%) Reinsurance
Operating Systems
1 18 (5.83%) Unix
2 2 (0.65%) Windows
3 1 (0.32%) Linux
3 1 (0.32%) Windows Server
Processes & Methodologies
1 309 (100.00%) Migration
2 68 (22.01%) Problem-Solving
3 53 (17.15%) ETL
4 43 (13.92%) DevOps
4 43 (13.92%) Validation
5 42 (13.59%) Data Modelling
6 36 (11.65%) ERP
7 35 (11.33%) Agile
8 33 (10.68%) Data Integration
8 33 (10.68%) Stakeholder Management
9 32 (10.36%) Data Governance
10 29 (9.39%) Test Automation
11 28 (9.06%) Data Management
12 26 (8.41%) Data Mapping
13 25 (8.09%) Data Cleansing
14 24 (7.77%) Business Intelligence
15 23 (7.44%) User Acceptance Testing
16 20 (6.47%) Analytics
16 20 (6.47%) Change Management
16 20 (6.47%) Data Transformation
Programming Languages
1 87 (28.16%) SQL
2 39 (12.62%) Python
3 19 (6.15%) PL/SQL
4 12 (3.88%) Java
5 6 (1.94%) Apex Code
5 6 (1.94%) JavaScript
5 6 (1.94%) T-SQL
6 5 (1.62%) C#
7 4 (1.29%) VBA
8 3 (0.97%) C
9 2 (0.65%) Data Analysis Expressions
9 2 (0.65%) R
9 2 (0.65%) SOQL
10 1 (0.32%) ABAP
10 1 (0.32%) Bash
10 1 (0.32%) PowerShell
10 1 (0.32%) TypeScript
10 1 (0.32%) VB
Qualifications
1 42 (13.59%) Security Cleared
2 36 (11.65%) SC Cleared
3 18 (5.83%) Degree
4 10 (3.24%) BPSS Clearance
5 5 (1.62%) Computer Science Degree
5 5 (1.62%) Master's Degree
5 5 (1.62%) PMI Certification
5 5 (1.62%) PMP
6 4 (1.29%) AWS Certification
6 4 (1.29%) AWS Certified Solutions Architect
7 3 (0.97%) TOGAF Certification
8 2 (0.65%) SAP Certification
9 1 (0.32%) ACCA
9 1 (0.32%) Azure Certification
9 1 (0.32%) CIMA
9 1 (0.32%) CTC Cleared
9 1 (0.32%) MBA
9 1 (0.32%) SnowPro
9 1 (0.32%) VMware Certified Professional (VCP)
Quality Assurance & Compliance
1 41 (13.27%) Data Quality
2 17 (5.50%) QA
3 7 (2.27%) GDPR
4 5 (1.62%) Accessibility
5 3 (0.97%) PMO
6 2 (0.65%) GAAP
7 1 (0.32%) California Consumer Privacy Act
7 1 (0.32%) Disclosure Scotland
7 1 (0.32%) HIPAA
7 1 (0.32%) IFRS
7 1 (0.32%) ISO 20022
7 1 (0.32%) PCI DSS
7 1 (0.32%) SEPA
7 1 (0.32%) SLA
System Software
1 9 (2.91%) Docker
2 6 (1.94%) Active Directory
Systems Management
1 5 (1.62%) Grafana
1 5 (1.62%) Oracle RMAN
1 5 (1.62%) Terraform
2 3 (0.97%) Kubernetes
2 3 (0.97%) Single Sign-On
3 2 (0.65%) Active Directory Federation Services
3 2 (0.65%) Ansible
3 2 (0.65%) Control-M
3 2 (0.65%) OMEGAMON
3 2 (0.65%) Prometheus
3 2 (0.65%) Tivoli
4 1 (0.32%) CEMLI
4 1 (0.32%) Istio
4 1 (0.32%) Kibana
4 1 (0.32%) logstash
4 1 (0.32%) Oracle Enterprise Manager
Vendors
1 58 (18.77%) Oracle
2 43 (13.92%) SAP
3 39 (12.62%) Microsoft
4 14 (4.53%) Salesforce
5 13 (4.21%) BMC
6 10 (3.24%) Ariba
6 10 (3.24%) Databricks
6 10 (3.24%) Google
7 8 (2.59%) Informatica
8 7 (2.27%) Alteryx
9 6 (1.94%) IFS
9 6 (1.94%) Infor
10 5 (1.62%) IBM
11 4 (1.29%) Atlassian
11 4 (1.29%) Commvault
12 3 (0.97%) Huawei
12 3 (0.97%) Nokia
12 3 (0.97%) TOWER Software
12 3 (0.97%) Workday
13 2 (0.65%) MuleSoft