SQL Server Contracts with Hybrid/Remote/WFH Options

Microsoft SQL Server (MS SQL)
UK > Work from Home

The table below provides summary statistics for remote or hybrid contract work requiring SQL Server skills. It includes a benchmarking guide to the contractor rates offered in vacancies that cited SQL Server over the 6 months leading up to 1 May 2025, comparing them to the same period in the previous two years.

6 months to
1 May 2025
Same period 2024 Same period 2023
Rank 96 51 43
Rank change year-on-year -45 -8 +8
Contract jobs citing SQL Server 257 570 1,281
As % of all contract jobs with a WFH option 2.59% 3.71% 4.95%
As % of the Database & Business Intelligence category 12.25% 19.58% 25.92%
Number of daily rates quoted 183 407 987
10th Percentile £313 £325 £388
25th Percentile £400 £400 £415
Median daily rate (50th Percentile) £500 £500 £525
Median % change year-on-year - -4.76% +8.28%
75th Percentile £588 £638 £651
90th Percentile £685 £705 £750
UK median daily rate £513 £509 £525
% change year-on-year +0.74% -3.10% +2.34%
Number of hourly rates quoted 4 3 14
10th Percentile £38.67 £12.78 £26.55
25th Percentile £57.21 £22.10 £37.88
Median hourly rate £80.00 £40.25 £47.00
Median % change year-on-year +98.76% -14.36% +0.71%
75th Percentile £92.50 £42.88 £85.00
90th Percentile - - -
UK median hourly rate £63.75 £40.13 £45.00
% change year-on-year +58.87% -10.83% -3.58%

All Database and Business Intelligence Skills
Work from Home

SQL Server falls under the Databases and Business Intelligence category. For comparison with the information above, the following table provides summary statistics for all contract job vacancies with remote or hybrid options requiring database or business intelligence skills.

Contract vacancies with a requirement for database or business intelligence skills 2,098 2,911 4,942
As % of all contract jobs with a WFH option 21.18% 18.97% 19.11%
Number of daily rates quoted 1,488 2,137 3,601
10th Percentile £363 £356 £386
25th Percentile £425 £425 £450
Median daily rate (50th Percentile) £525 £513 £525
Median % change year-on-year +2.44% -2.38% -
75th Percentile £675 £650 £650
90th Percentile £838 £750 £750
UK median daily rate £525 £525 £540
% change year-on-year - -2.78% -1.64%
Number of hourly rates quoted 21 37 79
10th Percentile £22.50 £20.06 £22.16
25th Percentile £30.00 £22.61 £43.57
Median hourly rate £63.00 £40.00 £66.00
Median % change year-on-year +57.50% -39.39% +46.67%
75th Percentile £66.00 £61.50 £75.00
90th Percentile £92.50 £70.25 £85.00
UK median hourly rate £32.96 £40.00 £60.00
% change year-on-year -17.60% -33.33% +41.18%

SQL Server
Trend for Jobs with a WFH Option

Job vacancies with remote working options citing SQL Server as a proportion of all IT jobs advertised.
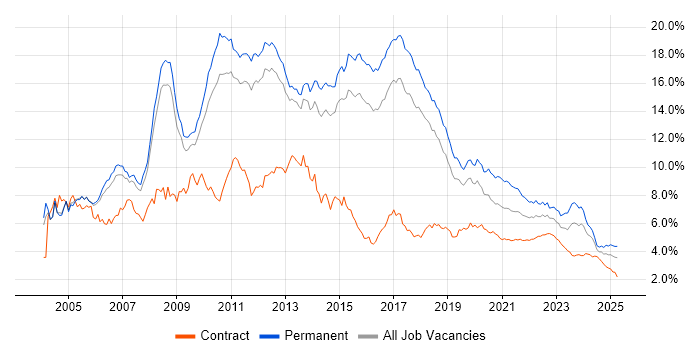
SQL Server trend for jobs with Hybrid/Remote/WFH options

SQL Server
Daily Rate Trend for Jobs with a WFH Option

3-month moving average daily rate quoted in job vacancies with remote working options citing SQL Server.

SQL Server daily rate for jobs with a WFH option

SQL Server
Daily Rate Histogram for Jobs with a WFH Option

Daily rate distribution for jobs with remote working options citing SQL Server over the 6 months to 1 May 2025.

SQL Server daily rate histogram for jobs with a WFH option

SQL Server
Hourly Rate Trend for Jobs with a WFH Option

3-month moving average hourly rate quoted in job vacancies with remote working options citing SQL Server.

SQL Server hourly rate for jobs with a WFH option

SQL Server
Hourly Rate Histogram for Jobs with a WFH Option

Hourly rate distribution for jobs with remote working options citing SQL Server over the 6 months to 1 May 2025.

SQL Server hourly rate histogram for jobs with a WFH option

SQL Server
Co-occurring Skills and Capabilities with WFH Options by Category

The follow tables expand on the table above by listing co-occurrences grouped by category. The same employment type, locality and period is covered with up to 20 co-occurrences shown in each of the following categories:

Application Platforms
1 21 (8.17%) SharePoint
2 20 (7.78%) Microsoft Exchange
3 11 (4.28%) Confluence
4 10 (3.89%) IIS
5 5 (1.95%) Apache
5 5 (1.95%) CMS
6 4 (1.56%) Drupal
6 4 (1.56%) WordPress
7 3 (1.17%) BizTalk Server
7 3 (1.17%) Skype for Business
8 2 (0.78%) Apache Spark
9 1 (0.39%) Apache Airflow
9 1 (0.39%) Appian
9 1 (0.39%) ArcGIS
9 1 (0.39%) FactoryTalk
9 1 (0.39%) Jupyter
9 1 (0.39%) SAS
9 1 (0.39%) Tomcat
9 1 (0.39%) Umbraco
Applications
1 16 (6.23%) Microsoft Excel
2 6 (2.33%) Microsoft Office
2 6 (2.33%) MS Visio
3 1 (0.39%) Notepad++
3 1 (0.39%) Trello
Business Applications
1 15 (5.84%) Dynamics CRM
2 4 (1.56%) Sparx Enterprise Architect
3 2 (0.78%) Actimize
3 2 (0.78%) Endur
3 2 (0.78%) SAP ERP
4 1 (0.39%) Fidessa
4 1 (0.39%) Kondor
4 1 (0.39%) Loan IQ
4 1 (0.39%) NEC Housing
4 1 (0.39%) Salesforce CRM
4 1 (0.39%) SAP S/4HANA
Cloud Services
1 133 (51.75%) Azure
2 45 (17.51%) AWS
3 40 (15.56%) Power Platform
4 29 (11.28%) Microsoft 365
5 26 (10.12%) Entra ID
6 16 (6.23%) Azure DevOps
7 14 (5.45%) GitHub
8 13 (5.06%) GCP
8 13 (5.06%) PowerApps
8 13 (5.06%) Serverless
9 12 (4.67%) Azure Cosmos DB
9 12 (4.67%) Dynamics 365
9 12 (4.67%) Power Automate
10 11 (4.28%) Azure Data Factory
11 10 (3.89%) Azure Functions
11 10 (3.89%) SaaS
12 9 (3.50%) Azure Service Bus
12 9 (3.50%) IaaS
13 8 (3.11%) Azure AKS
14 7 (2.72%) GitHub Actions
Communications & Networking
1 16 (6.23%) Firewall
2 11 (4.28%) DNS
3 8 (3.11%) Network Security
4 7 (2.72%) DHCP
4 7 (2.72%) Internet
5 6 (2.33%) TCP/IP
6 5 (1.95%) HTTP
6 5 (1.95%) Intrusion Detection
7 4 (1.56%) Remote Desktop
7 4 (1.56%) Wireless
8 3 (1.17%) iSCSI
8 3 (1.17%) LAN
8 3 (1.17%) Skype
8 3 (1.17%) WAN
8 3 (1.17%) Wi-Fi
9 2 (0.78%) SSL
9 2 (0.78%) VPN
10 1 (0.39%) HTTPS
10 1 (0.39%) Kerberos
10 1 (0.39%) SNMP
Database & Business Intelligence
1 36 (14.01%) SQL Server Integration Services
2 32 (12.45%) PostgreSQL
2 32 (12.45%) SQL Server Reporting Services
3 26 (10.12%) Power BI
4 23 (8.95%) Relational Database
5 21 (8.17%) Data Warehouse
6 20 (7.78%) Azure SQL Database
7 16 (6.23%) MySQL
8 12 (4.67%) MongoDB
8 12 (4.67%) Oracle Database
9 9 (3.50%) Data Lake
9 9 (3.50%) RDBMS
10 8 (3.11%) Big Data
10 8 (3.11%) NoSQL
11 7 (2.72%) SQL Server Analysis Services
11 7 (2.72%) Tableau
12 6 (2.33%) MS Access
13 5 (1.95%) Amazon RDS
13 5 (1.95%) Metadata
14 4 (1.56%) DB2
Development Applications
1 21 (8.17%) Git
2 20 (7.78%) JIRA
3 7 (2.72%) Visual Studio
4 6 (2.33%) Bitbucket
5 4 (1.56%) Bitbucket Server
5 4 (1.56%) GitLab
5 4 (1.56%) Jenkins
5 4 (1.56%) QARun
5 4 (1.56%) Team Foundation Server
5 4 (1.56%) WinRunner
6 3 (1.17%) ERwin
6 3 (1.17%) SonarQube
7 2 (0.78%) Cucumber
7 2 (0.78%) Flyway
7 2 (0.78%) Liquibase
7 2 (0.78%) MSTest
7 2 (0.78%) NUnit
7 2 (0.78%) Selenium
7 2 (0.78%) Subversion
7 2 (0.78%) TeamCity
General
1 69 (26.85%) Social Skills
2 60 (23.35%) Finance
3 31 (12.06%) Banking
4 24 (9.34%) Public Sector
5 17 (6.61%) Analytical Skills
6 9 (3.50%) Organisational Skills
7 7 (2.72%) Front Office
8 4 (1.56%) Back Office
8 4 (1.56%) Investment Banking
8 4 (1.56%) Telecoms
9 3 (1.17%) Inclusion and Diversity
9 3 (1.17%) Law
10 2 (0.78%) Advertising
10 2 (0.78%) Legal
11 1 (0.39%) Aviation
11 1 (0.39%) French Language
11 1 (0.39%) German Language
11 1 (0.39%) Local Government
11 1 (0.39%) Manufacturing
11 1 (0.39%) Military
Job Titles
1 77 (29.96%) Developer
2 32 (12.45%) Senior
3 28 (10.89%) Analyst
4 24 (9.34%) .NET Developer
5 21 (8.17%) DBA
6 20 (7.78%) Software Engineer
7 18 (7.00%) Architect
7 18 (7.00%) C# Developer
7 18 (7.00%) SQL DBA
8 14 (5.45%) Consultant
8 14 (5.45%) Data Engineer
9 13 (5.06%) Senior Developer
10 12 (4.67%) Lead
11 10 (3.89%) Full-Stack Developer
12 9 (3.50%) Data Analyst
12 9 (3.50%) Senior C# Developer
13 8 (3.11%) Applications Support
13 8 (3.11%) Python Software Engineer
13 8 (3.11%) Senior Software Engineer
13 8 (3.11%) Support Engineer
Libraries, Frameworks & Software Standards
1 61 (23.74%) .NET
2 28 (10.89%) AngularJS
2 28 (10.89%) REST
3 26 (10.12%) HTML
4 24 (9.34%) CSS
5 20 (7.78%) .NET Core
5 20 (7.78%) .NET Framework
5 20 (7.78%) SOAP
5 20 (7.78%) Web Services
6 19 (7.39%) ASP.NET
7 18 (7.00%) React
8 17 (6.61%) Kafka
9 15 (5.84%) RESTful
10 12 (4.67%) OAuth
11 11 (4.28%) Node.js
12 9 (3.50%) ASP.NET Web API
12 9 (3.50%) XML
13 8 (3.11%) Vue
13 8 (3.11%) WCF
14 7 (2.72%) JSON
Miscellaneous
1 10 (3.89%) Data Centre
2 9 (3.50%) Product Ownership
2 9 (3.50%) Replication
3 8 (3.11%) Clustering
3 8 (3.11%) Foreign Exchange (FX)
4 5 (1.95%) Derivative
4 5 (1.95%) Legacy Code
4 5 (1.95%) SWIFT Messaging Network
5 4 (1.56%) Data Protection Act
5 4 (1.56%) Data Structures
5 4 (1.56%) Legacy Systems
5 4 (1.56%) NHS
5 4 (1.56%) Reference Data
5 4 (1.56%) Renewable Energy
5 4 (1.56%) Self-Motivation
6 3 (1.17%) Cloud Native
6 3 (1.17%) Enterprise Software
6 3 (1.17%) Equities
6 3 (1.17%) IVR
6 3 (1.17%) PKI
Operating Systems
1 66 (25.68%) Windows
2 39 (15.18%) Windows Server
3 34 (13.23%) Linux
4 15 (5.84%) Unix
5 8 (3.11%) Windows Server 2016
6 7 (2.72%) Red Hat Enterprise Linux
7 6 (2.33%) Windows Server 2019
8 5 (1.95%) Windows Server 2012
9 4 (1.56%) Android
9 4 (1.56%) Windows 10
10 3 (1.17%) AIX
10 3 (1.17%) Solaris
11 2 (0.78%) Windows 7
12 1 (0.39%) Apple iOS
12 1 (0.39%) OpenVMS
12 1 (0.39%) Oracle Linux
Processes & Methodologies
1 66 (25.68%) Agile
2 60 (23.35%) Problem-Solving
3 51 (19.84%) DevOps
4 43 (16.73%) CI/CD
5 42 (16.34%) Migration
6 39 (15.18%) Software Engineering
7 31 (12.06%) Business Intelligence
7 31 (12.06%) Data Modelling
8 25 (9.73%) Performance Tuning
9 22 (8.56%) ITIL
10 21 (8.17%) ETL
10 21 (8.17%) High Availability
10 21 (8.17%) Scrum
10 21 (8.17%) Test Automation
11 19 (7.39%) Containerisation
11 19 (7.39%) Data Governance
12 18 (7.00%) CRM
12 18 (7.00%) Disaster Recovery
13 17 (6.61%) Data Analysis
13 17 (6.61%) Data Migration
Programming Languages
1 122 (47.47%) SQL
2 73 (28.40%) C#
3 39 (15.18%) JavaScript
4 38 (14.79%) PowerShell
5 37 (14.40%) Python
6 21 (8.17%) T-SQL
7 19 (7.39%) Java
8 14 (5.45%) TypeScript
9 11 (4.28%) PL/SQL
10 9 (3.50%) VB
11 6 (2.33%) Bash
12 5 (1.95%) PHP
12 5 (1.95%) VBA
13 3 (1.17%) Bicep
13 3 (1.17%) Data Analysis Expressions
14 2 (0.78%) Perl
14 2 (0.78%) R
14 2 (0.78%) Scala
14 2 (0.78%) VBScript
15 1 (0.39%) ActionScript 2.0
Qualifications
1 33 (12.84%) Security Cleared
2 32 (12.45%) SC Cleared
3 22 (8.56%) Degree
4 11 (4.28%) Microsoft Certification
5 8 (3.11%) Azure Certification
6 6 (2.33%) Computer Science Degree
7 2 (0.78%) DV Cleared
7 2 (0.78%) ITIL Certification
7 2 (0.78%) MCSA
7 2 (0.78%) MCSE
8 1 (0.39%) CITP
Quality Assurance & Compliance
1 18 (7.00%) GDPR
2 17 (6.61%) Data Quality
3 15 (5.84%) QA
4 11 (4.28%) Accessibility
5 8 (3.11%) Sarbanes-Oxley
6 4 (1.56%) ISO/IEC 27001
7 3 (1.17%) SLA
8 2 (0.78%) Cyber Essentials
8 2 (0.78%) Disclosure Scotland
8 2 (0.78%) Government Security Classifications
8 2 (0.78%) MiFID
9 1 (0.39%) Basel III
9 1 (0.39%) California Consumer Privacy Act
9 1 (0.39%) EMIR
9 1 (0.39%) HIPAA
9 1 (0.39%) HL7
9 1 (0.39%) ISO 20022
9 1 (0.39%) PCI DSS
9 1 (0.39%) SEPA
9 1 (0.39%) WCAG
System Software
1 35 (13.62%) Active Directory
2 23 (8.95%) Docker
3 9 (3.50%) VMware Infrastructure
4 8 (3.11%) vSphere
5 3 (1.17%) Microsoft Virtual Server
5 3 (1.17%) Virtual Servers
5 3 (1.17%) VMware ESXi
6 2 (0.78%) Oracle RAC
6 2 (0.78%) Virtual Machines
7 1 (0.39%) Hyper-V
7 1 (0.39%) Terminal Services
7 1 (0.39%) Virtual Desktop
Systems Management
1 24 (9.34%) Kubernetes
2 20 (7.78%) Terraform
3 7 (2.72%) Ansible
3 7 (2.72%) Microsoft Intune
4 5 (1.95%) SCCM
5 3 (1.17%) SCOM
5 3 (1.17%) WSUS
6 2 (0.78%) Active Directory Federation Services
6 2 (0.78%) Data Guard
6 2 (0.78%) OPNET
6 2 (0.78%) Oracle Enterprise Manager
6 2 (0.78%) Packer
7 1 (0.39%) Failover Clustering
7 1 (0.39%) FortiGate
7 1 (0.39%) Grafana
7 1 (0.39%) Microsoft Clustering
7 1 (0.39%) Oracle Flashback
7 1 (0.39%) Single Sign-On
7 1 (0.39%) Tivoli
7 1 (0.39%) Tivoli Storage Manager
Vendors
1 110 (42.80%) Microsoft
2 65 (25.29%) Oracle
3 18 (7.00%) VMware
4 12 (4.67%) Databricks
5 8 (3.11%) Sybase
6 7 (2.72%) CyberArk
6 7 (2.72%) IBM
6 7 (2.72%) Informatica
6 7 (2.72%) SAP
6 7 (2.72%) ServiceNow
7 6 (2.33%) Red Hat
8 5 (1.95%) Cisco
9 4 (1.56%) BiZZdesign
9 4 (1.56%) Sparx
9 4 (1.56%) Zend
10 3 (1.17%) Apple
10 3 (1.17%) Delphix
10 3 (1.17%) Google
10 3 (1.17%) Splunk
10 3 (1.17%) UiPath