Performance Optimisation Contracts with Hybrid/Remote/WFH Options

Performance Optimisation
UK > Work from Home

The table below provides summary statistics for remote or hybrid contract work requiring Performance Optimisation skills. It includes a benchmarking guide to the contractor rates offered in vacancies that cited Performance Optimisation over the 6 months leading up to 1 May 2025, comparing them to the same period in the previous two years.

6 months to
1 May 2025
Same period 2024 Same period 2023
Rank 202 290 398
Rank change year-on-year +88 +108 +137
Contract jobs citing Performance Optimisation 102 55 79
As % of all contract jobs with a WFH option 1.03% 0.36% 0.31%
As % of the Processes & Methodologies category 1.13% 0.41% 0.34%
Number of daily rates quoted 63 42 48
10th Percentile £371 £413 £443
25th Percentile £409 £450 £458
Median daily rate (50th Percentile) £475 £591 £510
Median % change year-on-year -19.59% +15.83% -5.12%
75th Percentile £600 £622 £675
90th Percentile £635 £761 £791
UK median daily rate £504 £565 £520
% change year-on-year -10.80% +8.65% -13.33%
Number of hourly rates quoted 0 0 1
Median hourly rate - - £38.00
UK median hourly rate £24.80 £57.57 £52.13
% change year-on-year -56.92% +10.44% +7.48%

All Process and Methodology Skills
Work from Home

Performance Optimisation falls under the Processes and Methodologies category. For comparison with the information above, the following table provides summary statistics for all contract job vacancies with remote or hybrid options requiring process or methodology skills.

Contract vacancies with a requirement for process or methodology skills 9,021 13,483 23,229
As % of all contract jobs with a WFH option 91.08% 87.87% 89.84%
Number of daily rates quoted 6,191 8,996 16,418
10th Percentile £340 £325 £363
25th Percentile £419 £425 £450
Median daily rate (50th Percentile) £525 £525 £540
Median % change year-on-year - -2.78% +2.86%
75th Percentile £638 £638 £650
90th Percentile £763 £750 £750
UK median daily rate £520 £525 £550
% change year-on-year -0.95% -4.55% +4.76%
Number of hourly rates quoted 224 579 532
10th Percentile £14.20 £15.17 £19.00
25th Percentile £19.56 £25.25 £30.54
Median hourly rate £39.52 £43.00 £55.00
Median % change year-on-year -8.09% -21.82% +57.14%
75th Percentile £66.13 £60.00 £68.75
90th Percentile £75.00 £75.25 £80.23
UK median hourly rate £29.00 £35.65 £37.30
% change year-on-year -18.65% -4.42% +49.20%

Performance Optimisation
Trend for Jobs with a WFH Option

Job vacancies with remote working options citing Performance Optimisation as a proportion of all IT jobs advertised.
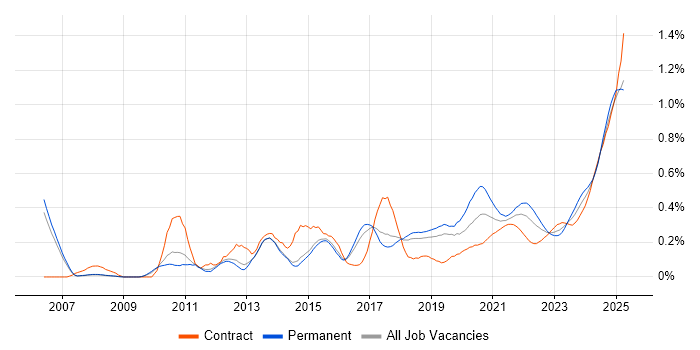
Performance Optimisation trend for jobs with Hybrid/Remote/WFH options

Performance Optimisation
Daily Rate Trend for Jobs with a WFH Option

3-month moving average daily rate quoted in job vacancies with remote working options citing Performance Optimisation.

Performance Optimisation daily rate for jobs with a WFH option

Performance Optimisation
Daily Rate Histogram for Jobs with a WFH Option

Daily rate distribution for jobs with remote working options citing Performance Optimisation over the 6 months to 1 May 2025.

Performance Optimisation daily rate histogram for jobs with a WFH option

Performance Optimisation
Hourly Rate Trend for Jobs with a WFH Option

3-month moving average hourly rate quoted in job vacancies with remote working options citing Performance Optimisation.

Performance Optimisation hourly rate for jobs with a WFH option

Performance Optimisation
Co-occurring Skills and Capabilities with WFH Options by Category

The follow tables expand on the table above by listing co-occurrences grouped by category. The same employment type, locality and period is covered with up to 20 co-occurrences shown in each of the following categories:

Application Platforms
1 5 (4.90%) Moodle
2 3 (2.94%) Anypoint
2 3 (2.94%) PowerExchange
3 1 (0.98%) Apache
3 1 (0.98%) Apache Airflow
3 1 (0.98%) Confluence
3 1 (0.98%) Mule
3 1 (0.98%) SAS
3 1 (0.98%) SharePoint
Applications
1 4 (3.92%) MS Visio
Business Applications
1 1 (0.98%) Aladdin
1 1 (0.98%) iTrent
1 1 (0.98%) NetSuite
1 1 (0.98%) Oracle EBS
1 1 (0.98%) Oracle EBS R12
1 1 (0.98%) Unit4 Business World
Cloud Services
1 26 (25.49%) Azure
2 19 (18.63%) AWS
3 12 (11.76%) GCP
4 8 (7.84%) Serverless
5 6 (5.88%) Snowflake
6 4 (3.92%) Amazon S3
6 4 (3.92%) AWS Lambda
6 4 (3.92%) Azure Functions
6 4 (3.92%) GitHub
7 3 (2.94%) Azure DevOps
7 3 (2.94%) GitHub Actions
8 2 (1.96%) Azure AKS
8 2 (1.96%) Azure Cognitive Services
8 2 (1.96%) Azure Data Factory
8 2 (1.96%) Azure Logic Apps
8 2 (1.96%) dbt
8 2 (1.96%) Power Platform
9 1 (0.98%) AWS Step Functions
9 1 (0.98%) Figma
9 1 (0.98%) Pulumi
Communications & Networking
1 6 (5.88%) Firewall
1 6 (5.88%) HTTPS
2 4 (3.92%) 5G
2 4 (3.92%) DNS
2 4 (3.92%) LTE
2 4 (3.92%) Radio Access Network
2 4 (3.92%) TCP/IP
2 4 (3.92%) VPN
3 1 (0.98%) Intrusion Detection
3 1 (0.98%) Kerberos
3 1 (0.98%) Network Security
3 1 (0.98%) SSH
Database & Business Intelligence
1 10 (9.80%) Oracle Database
2 8 (7.84%) Data Warehouse
3 7 (6.86%) PostgreSQL
3 7 (6.86%) SQL Server
4 5 (4.90%) Data Lake
4 5 (4.90%) Hadoop
5 4 (3.92%) Amazon Redshift
5 4 (3.92%) MySQL
5 4 (3.92%) NoSQL
6 3 (2.94%) Oracle Reports
6 3 (2.94%) Redis
6 3 (2.94%) Relational Database
7 2 (1.96%) Amazon RDS
7 2 (1.96%) Azure SQL Database
7 2 (1.96%) DB2
7 2 (1.96%) MongoDB
7 2 (1.96%) Power BI
7 2 (1.96%) RDBMS
7 2 (1.96%) Tableau
8 1 (0.98%) Base SAS
Development Applications
1 15 (14.71%) Git
2 6 (5.88%) Jenkins
3 5 (4.90%) PHPUnit
3 5 (4.90%) Postman
4 4 (3.92%) GitLab
5 2 (1.96%) JIRA
5 2 (1.96%) webpack
6 1 (0.98%) Android Studio
6 1 (0.98%) Bitbucket
6 1 (0.98%) Cucumber
6 1 (0.98%) Cypress.io
6 1 (0.98%) Flyway
6 1 (0.98%) Gerrit
6 1 (0.98%) JUnit
6 1 (0.98%) Liquibase
6 1 (0.98%) Mocha
6 1 (0.98%) Storybook
6 1 (0.98%) Vite
General
1 19 (18.63%) Social Skills
2 18 (17.65%) Finance
3 9 (8.82%) Analytical Skills
4 8 (7.84%) Public Sector
5 5 (4.90%) Telecoms
6 4 (3.92%) Banking
7 3 (2.94%) Front Office
7 3 (2.94%) Investment Banking
7 3 (2.94%) Manufacturing
7 3 (2.94%) Marketing
8 2 (1.96%) Games
9 1 (0.98%) Billing
9 1 (0.98%) Documentation Skills
9 1 (0.98%) Electronics
9 1 (0.98%) French Language
9 1 (0.98%) Inclusion and Diversity
9 1 (0.98%) Law
9 1 (0.98%) Organisational Skills
Job Titles
1 35 (34.31%) Developer
2 19 (18.63%) Senior
3 14 (13.73%) Senior Developer
4 10 (9.80%) Architect
5 8 (7.84%) Software Engineer
6 7 (6.86%) Consultant
7 6 (5.88%) Android Developer
7 6 (5.88%) Data Engineer
8 5 (4.90%) Data Architect
8 5 (4.90%) Moodle Developer
8 5 (4.90%) Senior Android Developer
9 4 (3.92%) Algorithm Engineer
9 4 (3.92%) C++ Software Engineer
9 4 (3.92%) Designer
9 4 (3.92%) Lead
9 4 (3.92%) Platform Architect
9 4 (3.92%) Software Engineer - Algorithmic Trading
9 4 (3.92%) Solutions Designer
10 3 (2.94%) Backend Developer
10 3 (2.94%) DevOps Engineer
Libraries, Frameworks & Software Standards
1 15 (14.71%) RESTful
2 8 (7.84%) XML
3 7 (6.86%) .NET
3 7 (6.86%) SOAP
4 6 (5.88%) Android SDK
4 6 (5.88%) JSON
5 5 (4.90%) .NET Core
5 5 (4.90%) AngularJS
5 5 (4.90%) Behat
5 5 (4.90%) Dagger
5 5 (4.90%) GraphQL
5 5 (4.90%) OAuth
5 5 (4.90%) React
6 4 (3.92%) CSS
6 4 (3.92%) HTML
6 4 (3.92%) JDBC
6 4 (3.92%) Middleware
6 4 (3.92%) OAuth2
6 4 (3.92%) OpenID
7 3 (2.94%) Kafka
Miscellaneous
1 8 (7.84%) Algorithms
1 8 (7.84%) Data Structures
2 6 (5.88%) Enterprise Software
2 6 (5.88%) Mobile App
3 5 (4.90%) Distributed Systems
3 5 (4.90%) e-Learning
3 5 (4.90%) VLE
4 4 (3.92%) Hedge funds
4 4 (3.92%) PKI
4 4 (3.92%) Taxonomies
5 3 (2.94%) Data Centre
5 3 (2.94%) Legacy Systems
6 2 (1.96%) Data Protection Act
6 2 (1.96%) Distributed Applications
6 2 (1.96%) Distributed Architecture
6 2 (1.96%) Fixed Income
6 2 (1.96%) Foreign Exchange (FX)
6 2 (1.96%) Greenfield Project
6 2 (1.96%) Mainframe
6 2 (1.96%) Virtual Team
Operating Systems
1 18 (17.65%) Linux
2 6 (5.88%) Android
3 5 (4.90%) Unix
4 3 (2.94%) Windows
5 2 (1.96%) Red Hat Enterprise Linux
5 2 (1.96%) Solaris
6 1 (0.98%) AIX
6 1 (0.98%) Embedded Linux
6 1 (0.98%) Ubuntu
6 1 (0.98%) Windows Server 2019
Processes & Methodologies
1 29 (28.43%) CI/CD
2 28 (27.45%) Agile
3 27 (26.47%) Problem-Solving
4 17 (16.67%) DevOps
5 15 (14.71%) Migration
5 15 (14.71%) Performance Tuning
6 14 (13.73%) Software Engineering
7 13 (12.75%) Code Quality
7 13 (12.75%) Infrastructure as Code
7 13 (12.75%) Mentoring
7 13 (12.75%) Microservices
8 12 (11.76%) Data Management
8 12 (11.76%) High Availability
8 12 (11.76%) Technical Leadership
8 12 (11.76%) User Experience
9 10 (9.80%) Analytics
9 10 (9.80%) Front End Development
9 10 (9.80%) Scrum
10 9 (8.82%) Computer Science
10 9 (8.82%) Data Security
Programming Languages
1 22 (21.57%) Python
1 22 (21.57%) SQL
2 16 (15.69%) JavaScript
3 14 (13.73%) Java
4 7 (6.86%) Bash
4 7 (6.86%) C++
4 7 (6.86%) TypeScript
5 6 (5.88%) C#
5 6 (5.88%) Kotlin
6 5 (4.90%) PHP
7 4 (3.92%) C
7 4 (3.92%) PL/SQL
7 4 (3.92%) PowerShell
8 3 (2.94%) Perl
8 3 (2.94%) Ruby
8 3 (2.94%) Shell Script
9 2 (1.96%) ActionScript
9 2 (1.96%) Assembly Language
9 2 (1.96%) JCL
9 2 (1.96%) Natural
Qualifications
1 22 (21.57%) Security Cleared
2 17 (16.67%) SC Cleared
3 10 (9.80%) Degree
4 8 (7.84%) Computer Science Degree
5 4 (3.92%) Master's Degree
6 2 (1.96%) AWS Certification
6 2 (1.96%) BPSS Clearance
6 2 (1.96%) RHCE
7 1 (0.98%) AWS Certified Solutions Architect
7 1 (0.98%) CISSP
7 1 (0.98%) CompTIA Security+
7 1 (0.98%) DV Cleared
7 1 (0.98%) IBM Certification
7 1 (0.98%) Linux+ Certification
Quality Assurance & Compliance
1 8 (7.84%) Accessibility
2 3 (2.94%) QA
3 2 (1.96%) Data Quality
3 2 (1.96%) Disclosure Scotland
4 1 (0.98%) California Consumer Privacy Act
4 1 (0.98%) Cyber Essentials
4 1 (0.98%) GDPR
4 1 (0.98%) HIPAA
4 1 (0.98%) PCI DSS
4 1 (0.98%) WCAG
System Software
1 19 (18.63%) Docker
2 1 (0.98%) Active Directory
2 1 (0.98%) Embedded Firmware
2 1 (0.98%) Firmware
2 1 (0.98%) KVM
2 1 (0.98%) NFS
2 1 (0.98%) QEMU
2 1 (0.98%) Samba
2 1 (0.98%) VMware Infrastructure
2 1 (0.98%) Xen
Systems Management
1 15 (14.71%) Kubernetes
2 14 (13.73%) Terraform
3 8 (7.84%) Ansible
4 4 (3.92%) Oracle Enterprise Manager
4 4 (3.92%) Single Sign-On
5 3 (2.94%) Data Guard
6 2 (1.96%) BMC PATROL
6 2 (1.96%) CloudHub
6 2 (1.96%) Nagios
7 1 (0.98%) Argo
7 1 (0.98%) Consul
7 1 (0.98%) Grafana
7 1 (0.98%) Istio
7 1 (0.98%) linkerd
7 1 (0.98%) Oracle RMAN
7 1 (0.98%) Progress Chef
7 1 (0.98%) Prometheus
7 1 (0.98%) SELinux
7 1 (0.98%) yum
7 1 (0.98%) ZABBIX
Vendors
1 13 (12.75%) Oracle
2 6 (5.88%) Databricks
2 6 (5.88%) Microsoft
2 6 (5.88%) Red Hat
3 5 (4.90%) IBM
4 4 (3.92%) ForgeRock
4 4 (3.92%) Ping Identity
5 3 (2.94%) Informatica
5 3 (2.94%) MuleSoft
6 2 (1.96%) BMC
6 2 (1.96%) Commvault
6 2 (1.96%) Fujitsu
6 2 (1.96%) Google
6 2 (1.96%) IBM Sterling
6 2 (1.96%) Salesforce
6 2 (1.96%) SAP
6 2 (1.96%) ServiceNow
6 2 (1.96%) Software AG
6 2 (1.96%) Splunk
6 2 (1.96%) VMware