Looker Contracts with Hybrid/Remote/WFH Options

Looker
UK > Work from Home

The table below provides summary statistics for remote or hybrid contract work requiring Looker skills. It includes a benchmarking guide to the contractor rates offered in vacancies that cited Looker over the 6 months leading up to 1 May 2025, comparing them to the same period in the previous two years.

6 months to
1 May 2025
Same period 2024 Same period 2023
Rank 272 315 459
Rank change year-on-year +43 +144 +104
Contract jobs citing Looker 32 30 18
As % of all contract jobs with a WFH option 0.32% 0.20% 0.070%
As % of the Database & Business Intelligence category 1.53% 1.03% 0.36%
Number of daily rates quoted 25 20 9
10th Percentile £143 £423 £325
25th Percentile £250 £431 £375
Median daily rate (50th Percentile) £400 £475 £450
Median % change year-on-year -15.79% +5.56% -10.00%
75th Percentile £488 £600 £525
90th Percentile £710 £655 £600
UK median daily rate £450 £475 £538
% change year-on-year -5.26% -11.63% +2.38%
Number of hourly rates quoted 0 0 2
10th Percentile - - £78.75
25th Percentile - - £80.63
Median hourly rate - - £85.00
75th Percentile - - £88.13
90th Percentile - - £89.25
UK median hourly rate - - £80.00

All Database and Business Intelligence Skills
Work from Home

Looker falls under the Databases and Business Intelligence category. For comparison with the information above, the following table provides summary statistics for all contract job vacancies with remote or hybrid options requiring database or business intelligence skills.

Contract vacancies with a requirement for database or business intelligence skills 2,098 2,911 4,942
As % of all contract jobs with a WFH option 21.18% 18.97% 19.11%
Number of daily rates quoted 1,488 2,137 3,601
10th Percentile £363 £356 £386
25th Percentile £425 £425 £450
Median daily rate (50th Percentile) £525 £513 £525
Median % change year-on-year +2.44% -2.38% -
75th Percentile £675 £650 £650
90th Percentile £838 £750 £750
UK median daily rate £525 £525 £540
% change year-on-year - -2.78% -1.64%
Number of hourly rates quoted 21 37 79
10th Percentile £22.50 £20.06 £22.16
25th Percentile £30.00 £22.61 £43.57
Median hourly rate £63.00 £40.00 £66.00
Median % change year-on-year +57.50% -39.39% +46.67%
75th Percentile £66.00 £61.50 £75.00
90th Percentile £92.50 £70.25 £85.00
UK median hourly rate £32.96 £40.00 £60.00
% change year-on-year -17.60% -33.33% +41.18%

Looker
Trend for Jobs with a WFH Option

Job vacancies with remote working options citing Looker as a proportion of all IT jobs advertised.
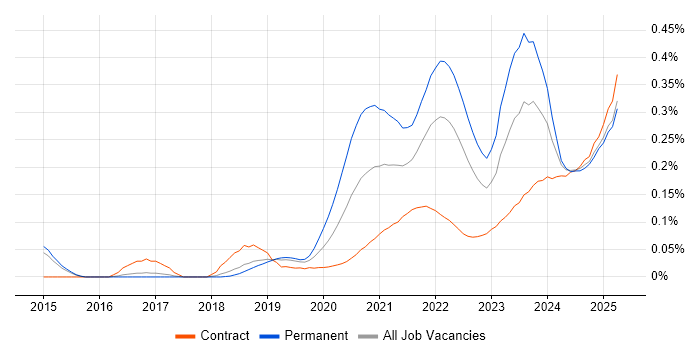
Looker trend for jobs with Hybrid/Remote/WFH options

Looker
Daily Rate Trend for Jobs with a WFH Option

3-month moving average daily rate quoted in job vacancies with remote working options citing Looker.

Looker daily rate for jobs with a WFH option

Looker
Daily Rate Histogram for Jobs with a WFH Option

Daily rate distribution for jobs with remote working options citing Looker over the 6 months to 1 May 2025.

Looker daily rate histogram for jobs with a WFH option

Looker
Hourly Rate Trend for Jobs with a WFH Option

3-month moving average hourly rate quoted in job vacancies with remote working options citing Looker.

Looker hourly rate for jobs with a WFH option

Looker
Co-occurring Skills and Capabilities with WFH Options by Category

The follow tables expand on the table above by listing co-occurrences grouped by category. The same employment type, locality and period is covered with up to 20 co-occurrences shown in each of the following categories:

Application Platforms
1 3 (9.38%) Apache Airflow
2 1 (3.13%) Adobe Experience Manager
2 1 (3.13%) Apache
2 1 (3.13%) Apache Spark
2 1 (3.13%) CMS
2 1 (3.13%) Confluence
Applications
1 3 (9.38%) Microsoft Excel
2 2 (6.25%) Microsoft PowerPoint
3 1 (3.13%) Microsoft Office
3 1 (3.13%) Microsoft Project
Business Applications
1 1 (3.13%) Adobe Campaign
1 1 (3.13%) Magento
1 1 (3.13%) Shopify
Cloud Services
1 23 (71.88%) GCP
2 12 (37.50%) Power Platform
3 4 (12.50%) Cloud Composer
3 4 (12.50%) Google Data Studio
4 3 (9.38%) Adobe Analytics
4 3 (9.38%) AWS
4 3 (9.38%) Azure
4 3 (9.38%) dbt
4 3 (9.38%) Google Ads
4 3 (9.38%) Google Analytics
5 2 (6.25%) Amazon CloudWatch
5 2 (6.25%) Cloud Functions
5 2 (6.25%) Datadog
5 2 (6.25%) Google Tag Manager
6 1 (3.13%) AppsFlyer
6 1 (3.13%) BigCommerce
6 1 (3.13%) Dialogflow
6 1 (3.13%) Google Sheets
6 1 (3.13%) Snowflake
6 1 (3.13%) Vertex AI
Communications & Networking
1 2 (6.25%) DHCP
1 2 (6.25%) DNS
1 2 (6.25%) DOCSIS
1 2 (6.25%) TCP/IP
1 2 (6.25%) Wi-Fi
2 1 (3.13%) Network Security
2 1 (3.13%) VLAN
2 1 (3.13%) Wireless
Database & Business Intelligence
1 17 (53.13%) BigQuery
2 13 (40.63%) Data Warehouse
3 12 (37.50%) Power BI
3 12 (37.50%) Tableau
4 2 (6.25%) InfluxDB
4 2 (6.25%) Qlik Sense
5 1 (3.13%) Hadoop
5 1 (3.13%) MongoDB
5 1 (3.13%) NoSQL
5 1 (3.13%) PostgreSQL
5 1 (3.13%) PowerPivot
5 1 (3.13%) Relational Database
Development Applications
1 2 (6.25%) Jenkins
1 2 (6.25%) JIRA
General
1 10 (31.25%) Social Skills
2 6 (18.75%) Finance
2 6 (18.75%) Marketing
3 5 (15.63%) Analytical Skills
4 2 (6.25%) Organisational Skills
5 1 (3.13%) Banking
5 1 (3.13%) Documentation Skills
5 1 (3.13%) Financial Institution
5 1 (3.13%) Health Technology
5 1 (3.13%) Inclusion and Diversity
5 1 (3.13%) Manufacturing
Job Titles
1 18 (56.25%) Analyst
2 12 (37.50%) Data Analyst
3 6 (18.75%) Data Engineer
4 3 (9.38%) Credit Analyst
4 3 (9.38%) Credit Risk Analyst
4 3 (9.38%) Junior
4 3 (9.38%) Junior Analyst
4 3 (9.38%) Junior Data Analyst
4 3 (9.38%) Marketing Analyst
4 3 (9.38%) Risk Analyst
5 2 (6.25%) Digital Analyst
5 2 (6.25%) Digital Marketing Analyst
5 2 (6.25%) SQL Analyst
6 1 (3.13%) Cloud Engineer
6 1 (3.13%) Content Coordinator
6 1 (3.13%) Data Analytics Analyst
6 1 (3.13%) Data Analytics Engineer
6 1 (3.13%) Data Business Analyst
6 1 (3.13%) GCP Data Engineer
6 1 (3.13%) GCP Engineer
Libraries, Frameworks & Software Standards
1 2 (6.25%) Elastic Stack
2 1 (3.13%) AngularJS
2 1 (3.13%) Kafka
2 1 (3.13%) NumPy
2 1 (3.13%) Pandas
2 1 (3.13%) PySpark
2 1 (3.13%) React
Miscellaneous
1 3 (9.38%) Credit Risk
2 2 (6.25%) Cloud Native
2 2 (6.25%) Embedded Systems
2 2 (6.25%) IoT
2 2 (6.25%) Video\Live Streaming
3 1 (3.13%) Data Structures
3 1 (3.13%) Derivative
3 1 (3.13%) Foreign Exchange (FX)
3 1 (3.13%) Interest Rate Derivative
3 1 (3.13%) Management Information System
3 1 (3.13%) Marketing Technology
3 1 (3.13%) Media Streaming
3 1 (3.13%) PMI
3 1 (3.13%) Sports Betting
3 1 (3.13%) Team-Oriented Environment
Operating Systems
1 2 (6.25%) Linux
Processes & Methodologies
1 13 (40.63%) Business Intelligence
2 12 (37.50%) Analytics
3 11 (34.38%) Data Analysis
3 11 (34.38%) Data Visualisation
3 11 (34.38%) Visualisation
4 10 (31.25%) Decision-Making
4 10 (31.25%) Problem-Solving
5 9 (28.13%) Data Governance
5 9 (28.13%) Data Pipeline
6 8 (25.00%) Actionable Insight
6 8 (25.00%) ETL
7 6 (18.75%) Fintech
8 5 (15.63%) Data Science
8 5 (15.63%) Data Strategy
8 5 (15.63%) E-Commerce
8 5 (15.63%) ETL Development
8 5 (15.63%) Machine Learning
8 5 (15.63%) Technical Debt
9 4 (12.50%) Agile
9 4 (12.50%) Observability
Programming Languages
1 21 (65.63%) SQL
2 12 (37.50%) Python
3 4 (12.50%) Java
4 2 (6.25%) C
4 2 (6.25%) C++
4 2 (6.25%) Go
4 2 (6.25%) R
4 2 (6.25%) Shell Script
5 1 (3.13%) C#
Qualifications
1 2 (6.25%) AWS Certification
2 1 (3.13%) PMI Certification
2 1 (3.13%) PMP
2 1 (3.13%) SC Cleared
2 1 (3.13%) Security Cleared
Quality Assurance & Compliance
1 9 (28.13%) Data Quality
2 3 (9.38%) QA
3 2 (6.25%) Actionable Recommendations
4 1 (3.13%) GDPR
Systems Management
1 2 (6.25%) Grafana
2 1 (3.13%) Terraform
Vendors
1 20 (62.50%) Google
2 4 (12.50%) Splunk
3 3 (9.38%) Adobe
4 2 (6.25%) New Relic
4 2 (6.25%) TikTok
5 1 (3.13%) Alteryx
5 1 (3.13%) Cisco
5 1 (3.13%) Databricks
5 1 (3.13%) WooCommerce