React Contracts with Work from Home Options

React.js
UK > Work from Home

The table below provides summary statistics for contract job vacancies with an option to work from home (WFH) and a requirement for React skills. Included is a benchmarking guide to the contractor rates offered in vacancies that have cited React over the 6 months to 25 April 2024 with a comparison to the same period in the previous 2 years.

6 months to
25 Apr 2024
Same period 2023 Same period 2022
Rank 58 52 35
Rank change year-on-year -6 -17 -10
Contract jobs citing React 518 1,121 2,641
As % of all contract jobs with a WFH option 3.36% 4.31% 5.95%
As % of the Libraries, Frameworks & Software Standards category 14.08% 17.05% 20.03%
Number of daily rates quoted 419 856 2,024
10th Percentile £350 £400 £404
25th Percentile £425 £438 £450
Median daily rate (50th Percentile) £525 £503 £550
Median % change year-on-year +4.48% -8.64% +15.79%
75th Percentile £694 £638 £650
90th Percentile £800 £750 £744
UK median daily rate £545 £533 £575
% change year-on-year +2.35% -7.39% +17.95%
Number of hourly rates quoted 8 8 14
10th Percentile £35.88 £37.10 -
25th Percentile £40.00 £43.25 £35.00
Median hourly rate £70.00 £62.50 £51.00
Median % change year-on-year +12.00% +22.55% +3.03%
75th Percentile £72.50 £66.81 £59.38
90th Percentile - £71.50 £78.88
UK median hourly rate £62.50 £70.00 £58.50
% change year-on-year -10.71% +19.66% +25.13%

All Software Libraries and Frameworks
Work from Home

React is in the Software Libraries and Frameworks category. The following table is for comparison with the above and provides summary statistics for all contract job vacancies with a WFH option and a requirement for technical specification, industry standards, software libraries and framework skills.

Contract vacancies with a requirement for technical specification, industry standards, software libraries and framework skills 3,679 6,574 13,188
As % of all contract jobs with a WFH option 23.85% 25.25% 29.69%
Number of daily rates quoted 2,557 4,900 9,761
10th Percentile £331 £394 £389
25th Percentile £428 £450 £450
Median daily rate (50th Percentile) £525 £540 £540
Median % change year-on-year -2.78% - +12.03%
75th Percentile £650 £660 £638
90th Percentile £775 £754 £725
UK median daily rate £525 £550 £550
% change year-on-year -4.55% - +10.00%
Number of hourly rates quoted 83 80 120
10th Percentile £24.45 £22.47 £21.00
25th Percentile - £37.94 £35.00
Median hourly rate £43.00 £64.50 £49.00
Median % change year-on-year -33.33% +31.63% +8.89%
75th Percentile £62.00 £75.00 £60.00
90th Percentile £72.50 £80.33 £67.80
UK median hourly rate £46.18 £65.00 £49.00
% change year-on-year -28.95% +32.65% +8.89%

React
Trend for Jobs with a WFH Option

Job vacancies with a work from home option citing React as a proportion of all IT jobs advertised.
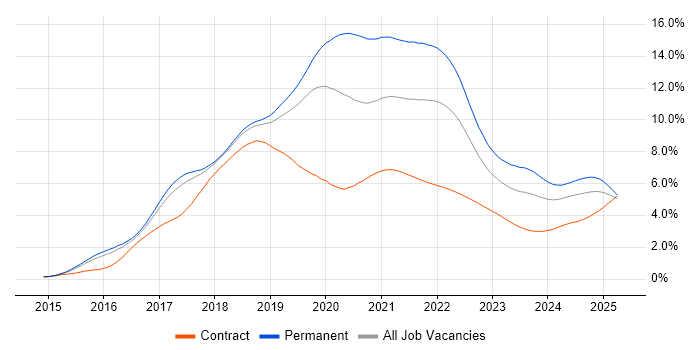
React trend for jobs with a WFH option

React
Daily Rate Trend for Jobs with a WFH Option

3-month moving average daily rate quoted in job vacancies with a work from home option citing React.

React daily rate for jobs with a WFH option

React
Daily Rate Histogram for Jobs with a WFH Option

Daily rate distribution for jobs with a work from home option citing React over the 6 months to 25 April 2024.

React daily rate histogram for jobs with a WFH option

React
Hourly Rate Trend for Jobs with a WFH Option

3-month moving average hourly rate quoted in job vacancies with a work from home option citing React.

React hourly rate for jobs with a WFH option

React
Hourly Rate Histogram for Jobs with a WFH Option

Hourly rate distribution for jobs with a work from home option citing React over the 6 months to 25 April 2024.

React hourly rate histogram for jobs with a WFH option

React
Co-occurring Skills and Capabilities with WFH Options by Category

The follow tables expand on the table above by listing co-occurrences grouped by category. The same employment type, locality and period is covered with up to 20 co-occurrences shown in each of the following categories:

Application Platforms
1 25 (4.83%) CMS
2 21 (4.05%) Apache Airflow
3 14 (2.70%) Confluence
4 12 (2.32%) Apache
4 12 (2.32%) WordPress
5 7 (1.35%) Headless CMS
6 5 (0.97%) Drupal
6 5 (0.97%) Kentico
7 3 (0.58%) SharePoint
7 3 (0.58%) Sitecore CMS
8 2 (0.39%) GeoServer
9 1 (0.19%) Adobe Experience Manager
9 1 (0.19%) Apache Solr
9 1 (0.19%) Ethereum
9 1 (0.19%) Hyperledger
9 1 (0.19%) IIS
9 1 (0.19%) nginx
9 1 (0.19%) OpenStack
9 1 (0.19%) Umbraco
Applications
1 1 (0.19%) InVision
1 1 (0.19%) Microsoft Excel
1 1 (0.19%) Microsoft Office
1 1 (0.19%) Microsoft PowerPoint
1 1 (0.19%) MS Visio
1 1 (0.19%) Sketch
Business Applications
1 5 (0.97%) Payment Gateway
2 2 (0.39%) Dynamics CRM
2 2 (0.39%) Endur
3 1 (0.19%) Magento
3 1 (0.19%) NEC Housing
3 1 (0.19%) RMDS
3 1 (0.19%) Shopify
Cloud Services
1 201 (38.80%) AWS
2 87 (16.80%) Azure
3 53 (10.23%) GCP
4 40 (7.72%) Serverless
5 34 (6.56%) Azure DevOps
6 33 (6.37%) AWS Lambda
7 29 (5.60%) Amazon S3
7 29 (5.60%) GitHub
8 18 (3.47%) AWS CloudFormation
9 17 (3.28%) Azure Cosmos DB
10 15 (2.90%) Azure Monitor
11 14 (2.70%) Amazon CloudWatch
11 14 (2.70%) SaaS
12 12 (2.32%) Azure Service Bus
12 12 (2.32%) Entra ID
12 12 (2.32%) npm
13 10 (1.93%) GitHub Actions
13 10 (1.93%) OpenShift
14 9 (1.74%) Amazon EC2
14 9 (1.74%) Azure Pipelines
Communications & Networking
1 10 (1.93%) Firewall
1 10 (1.93%) VPN
2 2 (0.39%) HTTP
3 1 (0.19%) DHCP
3 1 (0.19%) DNS
3 1 (0.19%) MQTT
3 1 (0.19%) RFID
3 1 (0.19%) TCP/IP
3 1 (0.19%) VLAN
Database & Business Intelligence
1 50 (9.65%) PostgreSQL
2 30 (5.79%) MySQL
3 29 (5.60%) SQL Server
4 20 (3.86%) MongoDB
4 20 (3.86%) Relational Database
5 18 (3.47%) Amazon Aurora
6 16 (3.09%) NoSQL
7 11 (2.12%) Elasticsearch
8 10 (1.93%) Apache Ignite
9 8 (1.54%) Amazon Athena
9 8 (1.54%) Amazon RDS
9 8 (1.54%) Apache Arrow
9 8 (1.54%) Dremio
10 6 (1.16%) DynamoDB
10 6 (1.16%) MariaDB
11 4 (0.77%) GIS
11 4 (0.77%) Oracle Database
11 4 (0.77%) Redis
12 3 (0.58%) Azure SQL Database
12 3 (0.58%) Power BI
Development Applications
1 74 (14.29%) Git
2 33 (6.37%) Cypress.io
3 29 (5.60%) Jenkins
3 29 (5.60%) JIRA
4 23 (4.44%) GitLab
4 23 (4.44%) webpack
5 10 (1.93%) Storybook
6 7 (1.35%) git-flow
6 7 (1.35%) Visual Studio Code
7 6 (1.16%) Bitbucket
8 4 (0.77%) Babel
8 4 (0.77%) Visual Studio
9 3 (0.58%) CircleCI
9 3 (0.58%) Postman
9 3 (0.58%) Selenium
10 2 (0.39%) JUnit
10 2 (0.39%) Mocha
10 2 (0.39%) Pylint
10 2 (0.39%) TeamCity
11 1 (0.19%) Ant
General
1 106 (20.46%) Finance
2 77 (14.86%) Social Skills
3 66 (12.74%) Front Office
4 30 (5.79%) Banking
4 30 (5.79%) Public Sector
5 26 (5.02%) Analytical Skills
6 12 (2.32%) Investment Banking
7 9 (1.74%) Retail
8 8 (1.54%) Financial Institution
8 8 (1.54%) Marketing
8 8 (1.54%) Pharmaceutical
9 6 (1.16%) Automotive
9 6 (1.16%) Tech for Good
10 4 (0.77%) Back Office
10 4 (0.77%) Digital Healthcare
10 4 (0.77%) German Language
10 4 (0.77%) Presentation Skills
11 3 (0.58%) Games
11 3 (0.58%) Manufacturing
12 2 (0.39%) Retail Banking
Job Titles
1 386 (74.52%) Developer
2 143 (27.61%) React Developer
3 118 (22.78%) Full Stack Developer
4 90 (17.37%) Front-End Developer (Client-Side Developer)
5 84 (16.22%) Senior
6 63 (12.16%) Senior Developer
7 54 (10.42%) Software Engineer
8 33 (6.37%) Python Developer
9 32 (6.18%) Developer/Software Engineer
9 32 (6.18%) JavaScript Developer
10 29 (5.60%) .NET Developer
11 27 (5.21%) C# Developer
12 26 (5.02%) Full Stack Engineer
12 26 (5.02%) UI Developer
13 24 (4.63%) Lead
14 22 (4.25%) AWS Developer
15 21 (4.05%) Java Developer
16 20 (3.86%) Architect
16 20 (3.86%) Senior React Developer
17 17 (3.28%) UI Engineer
Libraries, Frameworks & Software Standards
1 162 (31.27%) CSS
2 141 (27.22%) HTML
3 140 (27.03%) Node.js
4 89 (17.18%) AngularJS
5 70 (13.51%) Next.js
6 69 (13.32%) .NET
7 68 (13.13%) GraphQL
8 67 (12.93%) Redux
9 53 (10.23%) Vue
10 49 (9.46%) REST
11 33 (6.37%) Material-UI
12 29 (5.60%) .NET Core
13 27 (5.21%) Jest
14 26 (5.02%) RESTful
15 23 (4.44%) HTML5
16 22 (4.25%) gRPC
17 21 (4.05%) Protocol Buffers
17 21 (4.05%) Spring Boot
17 21 (4.05%) Tailwind CSS
18 20 (3.86%) React Native
Miscellaneous
1 53 (10.23%) Fixed Income
2 35 (6.76%) Product Ownership
3 20 (3.86%) Greenfield Project
4 18 (3.47%) Derivative
4 18 (3.47%) Foreign Exchange (FX)
4 18 (3.47%) Mobile App
5 16 (3.09%) Data Structures
6 13 (2.51%) Hedge funds
7 12 (2.32%) Legacy Systems
8 11 (2.12%) Algorithms
8 11 (2.12%) Equities
9 10 (1.93%) Distributed Systems
10 9 (1.74%) Enterprise Software
11 7 (1.35%) Cloud Native
12 5 (0.97%) Blockchain
13 4 (0.77%) Legacy Applications
13 4 (0.77%) Self-Motivation
13 4 (0.77%) Wiki
14 3 (0.58%) IoT
14 3 (0.58%) Renewable Energy
Operating Systems
1 12 (2.32%) Android
2 11 (2.12%) Linux
3 10 (1.93%) Apple iOS
4 2 (0.39%) Windows
5 1 (0.19%) Red Hat Enterprise Linux
5 1 (0.19%) Ubuntu
5 1 (0.19%) Unix
Processes & Methodologies
1 189 (36.49%) Full Stack Development
2 172 (33.20%) Agile
3 126 (24.32%) Front End Development
4 121 (23.36%) Software Engineering
5 96 (18.53%) CI/CD
6 89 (17.18%) DevOps
7 85 (16.41%) User Experience
8 68 (13.13%) Microservices
9 55 (10.62%) Problem-Solving
10 53 (10.23%) TDD
11 52 (10.04%) Test Automation
12 40 (7.72%) Web Development
13 39 (7.53%) Fintech
14 38 (7.34%) Asset Management
15 37 (7.14%) UX Design
16 33 (6.37%) Code Quality
16 33 (6.37%) Scrum
17 32 (6.18%) Clean Code
18 31 (5.98%) Design Patterns
18 31 (5.98%) E-Commerce
Programming Languages
1 274 (52.90%) TypeScript
2 268 (51.74%) JavaScript
3 111 (21.43%) Java
3 111 (21.43%) Python
4 66 (12.74%) C#
5 57 (11.00%) SQL
6 20 (3.86%) PHP
7 17 (3.28%) Kotlin
8 13 (2.51%) Bash
9 10 (1.93%) Bicep
10 8 (1.54%) Go
10 8 (1.54%) Ruby
11 6 (1.16%) PowerShell
11 6 (1.16%) Scala
12 5 (0.97%) C
13 4 (0.77%) C++
13 4 (0.77%) Shell Script
14 3 (0.58%) VB.NET
15 2 (0.39%) ABAP
15 2 (0.39%) F#
Qualifications
1 32 (6.18%) Security Cleared
2 21 (4.05%) Degree
2 21 (4.05%) SC Cleared
3 10 (1.93%) Computer Science Degree
4 6 (1.16%) DV Cleared
5 5 (0.97%) Master's Degree
6 1 (0.19%) Azure Certification
6 1 (0.19%) BPSS Clearance
6 1 (0.19%) Microsoft Certification
6 1 (0.19%) Numerate Degree
6 1 (0.19%) SANS
6 1 (0.19%) TOGAF Certification
Quality Assurance & Compliance
1 43 (8.30%) Accessibility
2 27 (5.21%) QA
3 12 (2.32%) WCAG
4 4 (0.77%) Disclosure Scotland
5 2 (0.39%) ISO/IEC 12207
5 2 (0.39%) SLA
6 1 (0.19%) Data Quality
6 1 (0.19%) GDPR
6 1 (0.19%) HL7
6 1 (0.19%) ISO 20022
6 1 (0.19%) NIST
6 1 (0.19%) Sarbanes-Oxley
System Software
1 46 (8.88%) Docker
2 16 (3.09%) Active Directory
3 3 (0.58%) zsh
Systems Management
1 50 (9.65%) Kubernetes
2 16 (3.09%) Terraform
3 9 (1.74%) Grafana
4 8 (1.54%) Ansible
5 3 (0.58%) Kibana
6 2 (0.39%) Progress Chef
6 2 (0.39%) Puppet
6 2 (0.39%) Single Sign-On
7 1 (0.19%) Argo
7 1 (0.19%) Bugsnag
7 1 (0.19%) logstash
7 1 (0.19%) Prometheus
Vendors
1 25 (4.83%) Microsoft
2 15 (2.90%) Oracle
3 11 (2.12%) Google
4 7 (1.35%) SAP
5 6 (1.16%) Salesforce
6 5 (0.97%) Atlassian
7 4 (0.77%) Sitecore
8 3 (0.58%) Adobe
8 3 (0.58%) WooCommerce
9 2 (0.39%) Dynatrace
9 2 (0.39%) ESRI
10 1 (0.19%) Ariba
10 1 (0.19%) ION Trading
10 1 (0.19%) NEC
10 1 (0.19%) Optimizely
10 1 (0.19%) Solace
10 1 (0.19%) Splunk