GDPR Contracts with Hybrid/Remote/WFH Options

General Data Protection Regulation EU 2016/679 (GDPR)
UK > Work from Home

The table below provides summary statistics for remote or hybrid contract work requiring GDPR skills. It includes a benchmarking guide to the contractor rates offered in vacancies that cited GDPR over the 6 months leading up to 1 May 2025, comparing them to the same period in the previous two years.

6 months to
1 May 2025
Same period 2024 Same period 2023
Rank 151 154 258
Rank change year-on-year +3 +104 -32
Contract jobs citing GDPR 163 210 233
As % of all contract jobs with a WFH option 1.65% 1.37% 0.90%
As % of the Quality Assurance & Compliance category 10.95% 9.38% 7.42%
Number of daily rates quoted 96 117 158
10th Percentile £333 £322 £393
25th Percentile £481 £419 £440
Median daily rate (50th Percentile) £550 £510 £550
Median % change year-on-year +7.84% -7.27% +7.84%
75th Percentile £650 £588 £650
90th Percentile £751 £738 £750
UK median daily rate £537 £500 £550
% change year-on-year +7.40% -9.09% -
Number of hourly rates quoted 9 10 8
10th Percentile £13.50 - £17.50
25th Percentile £17.80 £11.00 £18.40
Median hourly rate £31.76 £14.92 £32.50
Median % change year-on-year +112.87% -54.09% +18.18%
75th Percentile - £27.50 £65.25
90th Percentile £92.50 £27.53 £66.00
UK median hourly rate £27.50 £23.00 £24.50
% change year-on-year +19.54% -6.12% -5.77%

All Quality Assurance and Compliance Skills
Work from Home

GDPR falls under the Quality Assurance and Compliance category. For comparison with the information above, the following table provides summary statistics for all contract job vacancies with remote or hybrid options requiring quality assurance or compliance skills.

Contract vacancies with a requirement for quality assurance or compliance skills 1,488 2,240 3,140
As % of all contract jobs with a WFH option 15.02% 14.60% 12.14%
Number of daily rates quoted 1,005 1,532 2,292
10th Percentile £281 £313 £325
25th Percentile £400 £420 £415
Median daily rate (50th Percentile) £500 £510 £515
Median % change year-on-year -1.96% -0.97% +3.00%
75th Percentile £603 £623 £625
90th Percentile £713 £750 £725
UK median daily rate £500 £510 £525
% change year-on-year -1.96% -2.86% +2.44%
Number of hourly rates quoted 47 79 63
10th Percentile £17.98 £12.75 £18.54
25th Percentile £23.13 £14.00 £25.50
Median hourly rate £39.00 £22.87 £43.00
Median % change year-on-year +70.53% -46.81% -2.16%
75th Percentile £67.50 £44.38 £61.88
90th Percentile £87.15 £65.00 £72.35
UK median hourly rate £34.50 £20.80 £37.50
% change year-on-year +65.85% -44.53% +33.93%

GDPR
Trend for Jobs with a WFH Option

Job vacancies with remote working options citing GDPR as a proportion of all IT jobs advertised.
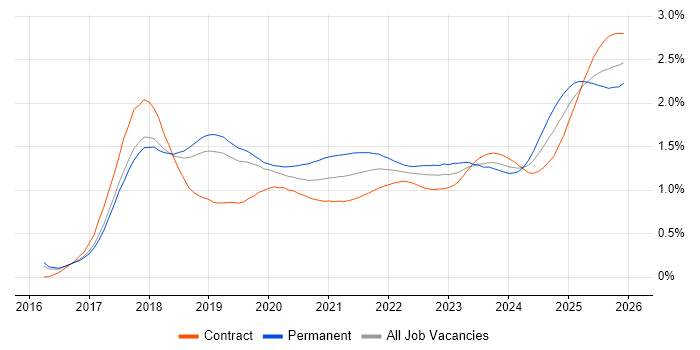
GDPR trend for jobs with Hybrid/Remote/WFH options

GDPR
Daily Rate Trend for Jobs with a WFH Option

3-month moving average daily rate quoted in job vacancies with remote working options citing GDPR.

GDPR daily rate for jobs with a WFH option

GDPR
Daily Rate Histogram for Jobs with a WFH Option

Daily rate distribution for jobs with remote working options citing GDPR over the 6 months to 1 May 2025.

GDPR daily rate histogram for jobs with a WFH option

GDPR
Hourly Rate Trend for Jobs with a WFH Option

3-month moving average hourly rate quoted in job vacancies with remote working options citing GDPR.

GDPR hourly rate for jobs with a WFH option

GDPR
Hourly Rate Histogram for Jobs with a WFH Option

Hourly rate distribution for jobs with remote working options citing GDPR over the 6 months to 1 May 2025.

GDPR hourly rate histogram for jobs with a WFH option

GDPR
Co-occurring Skills and Capabilities with WFH Options by Category

The follow tables expand on the table above by listing co-occurrences grouped by category. The same employment type, locality and period is covered with up to 20 co-occurrences shown in each of the following categories:

Application Platforms
1 5 (3.07%) Apache Spark
2 4 (2.45%) SharePoint
3 3 (1.84%) CMS
3 3 (1.84%) Umbraco
4 2 (1.23%) Apache
4 2 (1.23%) Confluence
4 2 (1.23%) Drupal
4 2 (1.23%) EPiServer
4 2 (1.23%) WordPress
5 1 (0.61%) Apache Airflow
5 1 (0.61%) Jupyter
Applications
1 6 (3.68%) Microsoft Excel
1 6 (3.68%) MS Visio
2 4 (2.45%) Microsoft Office
3 1 (0.61%) Chatbot
3 1 (0.61%) Microsoft PowerPoint
Business Applications
1 4 (2.45%) Sparx Enterprise Architect
2 3 (1.84%) SAP HR
3 2 (1.23%) CiviCRM
3 2 (1.23%) iTrent
3 2 (1.23%) SAP S/4HANA
3 2 (1.23%) Unit4 Business World
4 1 (0.61%) NEC Housing
4 1 (0.61%) NetSuite
4 1 (0.61%) Oracle Applications
4 1 (0.61%) Oracle ERP
4 1 (0.61%) Raiser’s Edge
4 1 (0.61%) SAP GRC
4 1 (0.61%) Workday HCM
Cloud Services
1 67 (41.10%) Azure
2 44 (26.99%) AWS
3 23 (14.11%) GCP
4 22 (13.50%) Power Platform
5 18 (11.04%) Entra ID
6 10 (6.13%) SaaS
7 9 (5.52%) Azure Sentinel
7 9 (5.52%) Microsoft 365
8 8 (4.91%) Serverless
9 6 (3.68%) Azure DevOps
9 6 (3.68%) Cloud Computing
9 6 (3.68%) IaaS
9 6 (3.68%) PaaS
10 5 (3.07%) GitHub
11 4 (2.45%) Amazon EC2
11 4 (2.45%) Azure Key Vault
11 4 (2.45%) Azure Logic Apps
11 4 (2.45%) Azure Synapse Analytics
11 4 (2.45%) Snowflake
11 4 (2.45%) Virtual Private Cloud
Communications & Networking
1 10 (6.13%) Firewall
2 6 (3.68%) Network Security
3 5 (3.07%) SSL
4 3 (1.84%) Intrusion Detection
5 2 (1.23%) DHCP
5 2 (1.23%) DNS
5 2 (1.23%) Intranet
5 2 (1.23%) TCP/IP
5 2 (1.23%) VPN
5 2 (1.23%) X.509
6 1 (0.61%) Ethernet
6 1 (0.61%) FTP
6 1 (0.61%) HTTP
6 1 (0.61%) Kerberos
6 1 (0.61%) NAS
6 1 (0.61%) SAN
6 1 (0.61%) SSH
6 1 (0.61%) VLAN
6 1 (0.61%) VSAN
Database & Business Intelligence
1 18 (11.04%) Power BI
1 18 (11.04%) SQL Server
2 8 (4.91%) Azure SQL Database
2 8 (4.91%) Data Warehouse
2 8 (4.91%) SQL Server Integration Services
2 8 (4.91%) Tableau
3 7 (4.29%) Big Data
4 6 (3.68%) Data Lake
4 6 (3.68%) Metadata
4 6 (3.68%) SQL Server Reporting Services
5 5 (3.07%) Apache Cassandra
5 5 (3.07%) Hadoop
5 5 (3.07%) MongoDB
5 5 (3.07%) NoSQL
5 5 (3.07%) SQL Server Analysis Services
6 4 (2.45%) Relational Database
7 3 (1.84%) Oracle Database
7 3 (1.84%) SAP Data Services
8 2 (1.23%) Amazon RDS
8 2 (1.23%) BigQuery
Development Applications
1 8 (4.91%) JIRA
2 4 (2.45%) Git
3 3 (1.84%) Jenkins
4 2 (1.23%) ERwin
4 2 (1.23%) Gradle
4 2 (1.23%) Postman
4 2 (1.23%) Visual Studio
5 1 (0.61%) Burp Suite
5 1 (0.61%) Cypress.io
5 1 (0.61%) Gatling
5 1 (0.61%) GitLab
5 1 (0.61%) JMeter
5 1 (0.61%) Metasploit
5 1 (0.61%) REST Assured
5 1 (0.61%) RStudio
5 1 (0.61%) Selenium
5 1 (0.61%) SonarQube
5 1 (0.61%) SpecFlow
5 1 (0.61%) TeamCity
5 1 (0.61%) Toad
General
1 56 (34.36%) Social Skills
2 34 (20.86%) Finance
3 29 (17.79%) Analytical Skills
4 12 (7.36%) Legal
5 9 (5.52%) Marketing
6 7 (4.29%) Public Sector
6 7 (4.29%) Retail
7 5 (3.07%) Banking
7 5 (3.07%) Organisational Skills
8 3 (1.84%) Automotive
8 3 (1.84%) Documentation Skills
8 3 (1.84%) Inclusion and Diversity
8 3 (1.84%) Law
8 3 (1.84%) Presentation Skills
8 3 (1.84%) Telecoms
9 2 (1.23%) Aerospace
9 2 (1.23%) Financial Institution
9 2 (1.23%) Local Government
9 2 (1.23%) Publishing
10 1 (0.61%) Investment Banking
Job Titles
1 34 (20.86%) Architect
2 20 (12.27%) Analyst
3 19 (11.66%) Consultant
4 11 (6.75%) Security Architect
5 9 (5.52%) Security Consultant
6 8 (4.91%) Lead
6 8 (4.91%) Senior
7 7 (4.29%) Data Engineer
8 6 (3.68%) Azure Architect
8 6 (3.68%) Business Analyst
8 6 (3.68%) Data Architect
8 6 (3.68%) Project Manager
8 6 (3.68%) Solutions Architect
9 5 (3.07%) Cloud Architect
9 5 (3.07%) Cybersecurity Analyst
9 5 (3.07%) Risk Manager
10 4 (2.45%) Administrator
10 4 (2.45%) IT Manager
10 4 (2.45%) Security Manager
10 4 (2.45%) Systems Analyst
Libraries, Frameworks & Software Standards
1 11 (6.75%) SailPoint
2 8 (4.91%) REST
2 8 (4.91%) SAML
3 7 (4.29%) OAuth
3 7 (4.29%) OpenID
4 6 (3.68%) Kafka
5 5 (3.07%) LDAP
5 5 (3.07%) PySpark
5 5 (3.07%) SOAP
6 4 (2.45%) Middleware
7 3 (1.84%) ARM Templates
7 3 (1.84%) AWS CDK
7 3 (1.84%) Azure Blueprints
7 3 (1.84%) Spring
7 3 (1.84%) Spring Boot
8 2 (1.23%) .NET
8 2 (1.23%) FHIR
8 2 (1.23%) React
8 2 (1.23%) Web Services
9 1 (0.61%) HTML
Miscellaneous
1 17 (10.43%) Management Information System
2 10 (6.13%) Data Protection Act
2 10 (6.13%) Security Posture
3 8 (4.91%) Enterprise Software
3 8 (4.91%) Onboarding
4 6 (3.68%) Legacy Systems
5 5 (3.07%) Algorithms
5 5 (3.07%) Hybrid Cloud
5 5 (3.07%) Linux Command Line
5 5 (3.07%) Self-Motivation
6 4 (2.45%) Data Centre
6 4 (2.45%) Social Media
7 3 (1.84%) Cloud Native
7 3 (1.84%) Cyberattack
7 3 (1.84%) Data Structures
7 3 (1.84%) PKI
7 3 (1.84%) Product Ownership
7 3 (1.84%) Reinsurance
8 2 (1.23%) Legacy Applications
8 2 (1.23%) Multi-touch
Operating Systems
1 13 (7.98%) Linux
2 10 (6.13%) Windows
3 5 (3.07%) Windows Server
4 1 (0.61%) CentOS
4 1 (0.61%) Oracle Linux
4 1 (0.61%) Red Hat Enterprise Linux
4 1 (0.61%) Solaris
4 1 (0.61%) Ubuntu
Processes & Methodologies
1 45 (27.61%) Problem-Solving
2 33 (20.25%) Data Protection
3 29 (17.79%) DevOps
4 28 (17.18%) Analytics
4 28 (17.18%) Cybersecurity
5 27 (16.56%) Data Governance
6 26 (15.95%) Migration
7 24 (14.72%) Information Security
8 23 (14.11%) Identity Access Management
8 23 (14.11%) Project Management
9 22 (13.50%) Data Management
9 22 (13.50%) Risk Management
10 21 (12.88%) Business Intelligence
10 21 (12.88%) Incident Response
10 21 (12.88%) Stakeholder Management
11 20 (12.27%) Data Security
12 19 (11.66%) Agile
13 18 (11.04%) Cloud Security
13 18 (11.04%) Regulatory Compliance
14 17 (10.43%) Data Privacy
Programming Languages
1 30 (18.40%) SQL
2 28 (17.18%) Python
3 22 (13.50%) PowerShell
4 9 (5.52%) Java
5 6 (3.68%) Bash
6 5 (3.07%) T-SQL
7 3 (1.84%) Bicep
7 3 (1.84%) PL/SQL
7 3 (1.84%) TypeScript
8 2 (1.23%) C
8 2 (1.23%) C#
8 2 (1.23%) JavaScript
8 2 (1.23%) Kusto Query Language
8 2 (1.23%) Scala
9 1 (0.61%) Apex Code
9 1 (0.61%) C++
9 1 (0.61%) PHP
9 1 (0.61%) Ruby
9 1 (0.61%) Shell Script
9 1 (0.61%) VBScript
Qualifications
1 28 (17.18%) Degree
2 23 (14.11%) CISSP
3 17 (10.43%) CISM
4 15 (9.20%) SC Cleared
4 15 (9.20%) Security Cleared
5 9 (5.52%) Computer Science Degree
6 7 (4.29%) CEH
6 7 (4.29%) CISA
7 6 (3.68%) Master's Degree
8 5 (3.07%) AWS Certification
8 5 (3.07%) Azure Certification
8 5 (3.07%) CompTIA Security+
9 4 (2.45%) ISO 27001 Lead Auditor
10 3 (1.84%) CRISC
10 3 (1.84%) GIAC
10 3 (1.84%) Microsoft Certification
11 2 (1.23%) Cisco Certification
11 2 (1.23%) ISEB
11 2 (1.23%) PMI Certification
11 2 (1.23%) PMP
Quality Assurance & Compliance
1 40 (24.54%) NIST
2 36 (22.09%) ISO/IEC 27001
3 30 (18.40%) HIPAA
4 27 (16.56%) PCI DSS
5 22 (13.50%) Sarbanes-Oxley
6 20 (12.27%) Data Quality
7 12 (7.36%) Accessibility
7 12 (7.36%) California Consumer Privacy Act
8 9 (5.52%) SOC 2
9 6 (3.68%) GRC
10 4 (2.45%) COBIT
11 3 (1.84%) COSO
11 3 (1.84%) NIST 800
11 3 (1.84%) QA
12 2 (1.23%) FIPS 140-2
12 2 (1.23%) SLA
13 1 (0.61%) Cyber Essentials
13 1 (0.61%) Disclosure Scotland
13 1 (0.61%) MiFID
13 1 (0.61%) SNOMED CT
System Software
1 22 (13.50%) Active Directory
2 6 (3.68%) Virtual Machines
3 5 (3.07%) Docker
4 3 (1.84%) VMware Infrastructure
5 2 (1.23%) Hyper-V
6 1 (0.61%) VMware ESXi
6 1 (0.61%) VMware NSX
6 1 (0.61%) vSphere
Systems Management
1 9 (5.52%) Terraform
2 8 (4.91%) Single Sign-On
3 3 (1.84%) Kubernetes
4 2 (1.23%) Ansible
4 2 (1.23%) Nessus
5 1 (0.61%) Active Directory Federation Services
5 1 (0.61%) EMC NetWorker
5 1 (0.61%) Grafana
5 1 (0.61%) HP Fortify
5 1 (0.61%) Netcool
5 1 (0.61%) Prometheus
5 1 (0.61%) QRadar
5 1 (0.61%) Tivoli
5 1 (0.61%) Tivoli Storage Manager
Vendors
1 38 (23.31%) Microsoft
2 10 (6.13%) Google
2 10 (6.13%) SAP
3 8 (4.91%) CyberArk
3 8 (4.91%) Okta
3 8 (4.91%) Oracle
4 7 (4.29%) Informatica
5 5 (3.07%) Databricks
6 4 (2.45%) BiZZdesign
6 4 (2.45%) Ping Identity
6 4 (2.45%) Qualys
6 4 (2.45%) Salesforce
6 4 (2.45%) ServiceNow
6 4 (2.45%) Sparx
6 4 (2.45%) Workday
7 3 (1.84%) BeyondTrust
7 3 (1.84%) ForgeRock
7 3 (1.84%) MuleSoft
7 3 (1.84%) VMware
8 2 (1.23%) Thycotic