DevOps Jobs in Birmingham

DevOps
West Midlands > Birmingham

The following table provides summary statistics for permanent job vacancies advertised in Birmingham with a requirement for DevOps skills. Included is a benchmarking guide to the salaries offered in vacancies that have cited DevOps over the 6 months to 8 May 2024 with a comparison to the same period in the previous 2 years.

6 months to
8 May 2024
Same period 2023 Same period 2022
Rank 16 10 10
Rank change year-on-year -6 0 -2
Permanent jobs citing DevOps 232 270 483
As % of all permanent jobs advertised in Birmingham 8.42% 13.90% 15.55%
As % of the Processes & Methodologies category 10.26% 14.49% 15.89%
Number of salaries quoted 203 196 375
10th Percentile £38,750 £34,000 £40,399
25th Percentile £46,250 £48,438 £47,250
Median annual salary (50th Percentile) £65,000 £60,000 £62,500
Median % change year-on-year +8.33% -4.00% -
75th Percentile £82,500 £77,500 £75,000
90th Percentile £98,500 £85,000 £85,000
West Midlands median annual salary £60,000 £57,500 £60,000
% change year-on-year +4.35% -4.17% -

All Process and Methodology Skills
Birmingham

DevOps is in the Processes and Methodologies category. The following table is for comparison with the above and provides summary statistics for all permanent job vacancies advertised in Birmingham with a requirement for process or methodology skills.

Permanent vacancies with a requirement for process or methodology skills 2,262 1,863 3,039
As % of all permanent jobs advertised in Birmingham 82.14% 95.88% 97.84%
Number of salaries quoted 1,832 1,371 2,281
10th Percentile £32,000 £31,250 £34,500
25th Percentile £41,000 £43,725 £42,500
Median annual salary (50th Percentile) £55,000 £55,000 £55,000
Median % change year-on-year - - +4.76%
75th Percentile £69,914 £71,250 £70,000
90th Percentile £84,964 £82,500 £83,750
West Midlands median annual salary £50,000 £53,000 £50,000
% change year-on-year -5.66% +6.00% +5.26%

DevOps
Job Vacancy Trend in Birmingham

Job postings citing DevOps as a proportion of all IT jobs advertised in Birmingham.
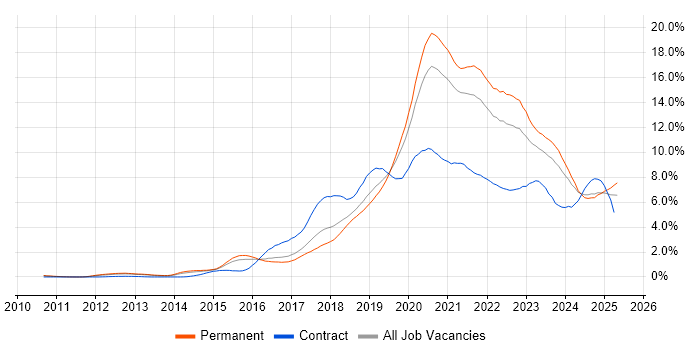
Job vacancy trend for DevOps in Birmingham

DevOps
Salary Trend in Birmingham

3-month moving average salary quoted in jobs citing DevOps in Birmingham.

Salary trend for DevOps in Birmingham

DevOps
Salary Histogram in Birmingham

Salary distribution for jobs citing DevOps in Birmingham over the 6 months to 8 May 2024.

Salary histogram for DevOps in Birmingham

DevOps
Co-occurring Skills and Capabilities in Birmingham by Category

The follow tables expand on the table above by listing co-occurrences grouped by category. The same employment type, locality and period is covered with up to 20 co-occurrences shown in each of the following categories:

Application Platforms
1 17 (7.33%) SharePoint
2 13 (5.60%) IIS
3 8 (3.45%) Microsoft Exchange
4 5 (2.16%) nginx
5 3 (1.29%) Confluence
6 2 (0.86%) Apache
6 2 (0.86%) Apache Airflow
6 2 (0.86%) Apache Spark
Applications
1 6 (2.59%) Microsoft Project
2 4 (1.72%) Microsoft Excel
3 3 (1.29%) MS Visio
4 1 (0.43%) Adobe Illustrator
4 1 (0.43%) Adobe XD
4 1 (0.43%) InVision
4 1 (0.43%) Microsoft PowerPoint
4 1 (0.43%) Photoshop
4 1 (0.43%) Sketch
Business Applications
1 14 (6.03%) Dynamics CRM
2 2 (0.86%) Oracle EBS
3 1 (0.43%) Dynamics AX
Cloud Services
1 143 (61.64%) Azure
2 96 (41.38%) Azure DevOps
3 46 (19.83%) AWS
4 37 (15.95%) Dynamics 365
5 35 (15.09%) Power Platform
6 32 (13.79%) Microsoft 365
7 29 (12.50%) SaaS
8 24 (10.34%) GCP
9 19 (8.19%) PaaS
10 18 (7.76%) IaaS
11 13 (5.60%) PowerApps
12 11 (4.74%) Snowflake
13 9 (3.88%) Amazon S3
14 8 (3.45%) Amazon EC2
15 7 (3.02%) Azure AKS
16 6 (2.59%) Azure Data Factory
16 6 (2.59%) Azure Stack
16 6 (2.59%) dbt
16 6 (2.59%) GitHub
16 6 (2.59%) Power Automate
Communications & Networking
1 11 (4.74%) VPN
2 10 (4.31%) NGFW
3 4 (1.72%) DNS
3 4 (1.72%) Unified Communications
4 3 (1.29%) HTTP
5 2 (0.86%) DHCP
5 2 (0.86%) IPv6
6 1 (0.43%) 3GPP
6 1 (0.43%) 5G
6 1 (0.43%) Firewall
6 1 (0.43%) LAN
6 1 (0.43%) Network Security
6 1 (0.43%) TCP/IP
6 1 (0.43%) WAN
6 1 (0.43%) WLAN
Database & Business Intelligence
1 31 (13.36%) SQL Server
2 17 (7.33%) Elasticsearch
3 14 (6.03%) Power BI
4 11 (4.74%) Data Warehouse
4 11 (4.74%) MySQL
5 10 (4.31%) Amazon Redshift
6 7 (3.02%) BigQuery
7 6 (2.59%) SQL Server Reporting Services
7 6 (2.59%) Tableau
8 5 (2.16%) NoSQL
9 4 (1.72%) Amazon RDS
9 4 (1.72%) InterSystems Cache
9 4 (1.72%) RDBMS
9 4 (1.72%) Relational Database
10 3 (1.29%) Looker
11 2 (0.86%) Apache Cassandra
11 2 (0.86%) Azure SQL Data Warehouse
11 2 (0.86%) Azure SQL Database
11 2 (0.86%) MongoDB
11 2 (0.86%) SQL Server Integration Services
Development Applications
1 26 (11.21%) Git
2 18 (7.76%) GitLab
3 12 (5.17%) JIRA
3 12 (5.17%) Visual Studio
4 11 (4.74%) Jenkins
5 9 (3.88%) Jasmine
5 9 (3.88%) TeamCity
6 7 (3.02%) Octopus Deploy
7 6 (2.59%) Team Foundation Server
8 5 (2.16%) Karma Test Runner
8 5 (2.16%) Postman
8 5 (2.16%) webpack
9 2 (0.86%) MSBuild
9 2 (0.86%) NUnit
9 2 (0.86%) Sonatype Nexus
10 1 (0.43%) Balsamiq
10 1 (0.43%) Moq
10 1 (0.43%) SoapUI
10 1 (0.43%) Sourcetree
10 1 (0.43%) Visual Studio Team System
General
1 44 (18.97%) Social Skills
2 32 (13.79%) Finance
3 16 (6.90%) Inclusion and Diversity
4 13 (5.60%) Public Sector
5 9 (3.88%) Automotive
6 8 (3.45%) Analytical Skills
6 8 (3.45%) Marketing
7 6 (2.59%) Law
7 6 (2.59%) Legal
8 4 (1.72%) Organisational Skills
8 4 (1.72%) Police
9 3 (1.29%) Digital Healthcare
9 3 (1.29%) Influencing Skills
9 3 (1.29%) Telecoms
10 2 (0.86%) Banking
10 2 (0.86%) Electronics
10 2 (0.86%) Games
10 2 (0.86%) Manufacturing
11 1 (0.43%) Publishing
11 1 (0.43%) Retail
Job Titles
1 53 (22.84%) Developer
2 43 (18.53%) Senior
3 27 (11.64%) Lead
4 24 (10.34%) DevOps Engineer
5 23 (9.91%) Architect
6 19 (8.19%) Analyst
7 17 (7.33%) Consultant
8 16 (6.90%) Full Stack Developer
9 14 (6.03%) Junior
10 13 (5.60%) Business Analyst
10 13 (5.60%) Senior Developer
10 13 (5.60%) Software Engineer
11 11 (4.74%) Citrix Architect
11 11 (4.74%) Cloud Architect
11 11 (4.74%) DevOps Architect
12 10 (4.31%) Cloud Infrastructure Architect
12 10 (4.31%) Data Engineer
12 10 (4.31%) Junior DevOps
12 10 (4.31%) Junior DevOps Engineer
13 9 (3.88%) Head of DevOps
Libraries, Frameworks & Software Standards
1 42 (18.10%) .NET
2 27 (11.64%) React
3 20 (8.62%) JSON
4 19 (8.19%) HTML
5 17 (7.33%) CSS
6 16 (6.90%) ARM Templates
7 14 (6.03%) .NET Framework
7 14 (6.03%) AngularJS
7 14 (6.03%) YAML
8 13 (5.60%) ASP.NET
9 12 (5.17%) Web Services
10 11 (4.74%) Node.js
10 11 (4.74%) RESTful
11 10 (4.31%) Sass
12 9 (3.88%) SOAP
13 8 (3.45%) Entity Framework
14 7 (3.02%) Vue
15 6 (2.59%) REST
15 6 (2.59%) Spring
15 6 (2.59%) XML
Miscellaneous
1 22 (9.48%) Private Cloud
2 16 (6.90%) Cloud Native
3 14 (6.03%) Public Cloud
4 13 (5.60%) Low-Code
4 13 (5.60%) Product Ownership
5 10 (4.31%) Enterprise Software
5 10 (4.31%) Management Information System
6 9 (3.88%) Self-Motivation
7 8 (3.45%) Mobile App
8 6 (2.59%) Data Structures
8 6 (2.59%) FMCG
9 4 (1.72%) Data Centre
9 4 (1.72%) NHS
9 4 (1.72%) Team-Oriented Environment
10 2 (0.86%) BYOD
10 2 (0.86%) Virtual Team
11 1 (0.43%) Data Protection Act
11 1 (0.43%) Distributed Computing
11 1 (0.43%) Distributed Denial-of-Service
11 1 (0.43%) IoT
Operating Systems
1 8 (3.45%) Linux
2 7 (3.02%) Windows
3 4 (1.72%) Android
3 4 (1.72%) Apple iOS
3 4 (1.72%) VMS
4 2 (0.86%) Mac OS
5 1 (0.43%) Unix
Processes & Methodologies
1 113 (48.71%) Agile
2 90 (38.79%) CI/CD
3 51 (21.98%) Infrastructure as Code
4 50 (21.55%) Software Engineering
5 45 (19.40%) Continuous Improvement
6 40 (17.24%) Scrum
7 39 (16.81%) Continuous Integration
8 32 (13.79%) Mentoring
9 29 (12.50%) Containerisation
10 26 (11.21%) SDLC
11 25 (10.78%) User Stories
12 24 (10.34%) Problem-Solving
12 24 (10.34%) Test Automation
13 22 (9.48%) Business Intelligence
13 22 (9.48%) Coaching
13 22 (9.48%) Full Stack Development
14 21 (9.05%) Project Management
15 20 (8.62%) User Experience
16 18 (7.76%) Presales
17 17 (7.33%) Site Reliability Engineering
Programming Languages
1 60 (25.86%) C#
2 51 (21.98%) JavaScript
3 38 (16.38%) Python
4 33 (14.22%) SQL
5 32 (13.79%) TypeScript
6 23 (9.91%) Java
7 22 (9.48%) PowerShell
8 12 (5.17%) PHP
9 10 (4.31%) T-SQL
10 9 (3.88%) VB
11 8 (3.45%) Bicep
12 5 (2.16%) VB.NET
12 5 (2.16%) VB6
13 4 (1.72%) Bash
14 3 (1.29%) Kotlin
15 2 (0.86%) C++
15 2 (0.86%) Swift
16 1 (0.43%) Shell Script
Qualifications
1 19 (8.19%) Degree
1 19 (8.19%) Security Cleared
2 17 (7.33%) SC Cleared
3 10 (4.31%) Azure Certification
4 6 (2.59%) Computer Science Degree
5 5 (2.16%) ISTQB
6 4 (1.72%) AWS Certification
6 4 (1.72%) AWS Certified Solutions Architect
7 3 (1.29%) DBS Check
8 2 (0.86%) ITIL Certification
8 2 (0.86%) MCSE
8 2 (0.86%) Microsoft Certification
9 1 (0.43%) Citrix Certification
9 1 (0.43%) HNC
Quality Assurance & Compliance
1 30 (12.93%) QA
2 11 (4.74%) Accessibility
3 7 (3.02%) PMO
4 3 (1.29%) GDPR
5 2 (0.86%) Cyber Essentials
5 2 (0.86%) NIST
5 2 (0.86%) SLA
6 1 (0.43%) Data Quality
6 1 (0.43%) IFRS
6 1 (0.43%) IFRS 17
6 1 (0.43%) NCSC
6 1 (0.43%) Solvency II
System Software
1 19 (8.19%) Docker
2 10 (4.31%) Virtual Desktop
2 10 (4.31%) VMware ESXi
2 10 (4.31%) VMware Infrastructure
2 10 (4.31%) vSphere
3 1 (0.43%) Virtual Machines
Systems Management
1 52 (22.41%) Terraform
2 29 (12.50%) Kubernetes
3 4 (1.72%) Ansible
4 2 (0.86%) Microsoft Intune
4 2 (0.86%) MIIS
4 2 (0.86%) Progress Chef
4 2 (0.86%) Puppet
5 1 (0.43%) Grafana
5 1 (0.43%) Prometheus
Vendors
1 69 (29.74%) Microsoft
2 11 (4.74%) Citrix
3 10 (4.31%) VMware
3 10 (4.31%) YouTube
4 8 (3.45%) Databricks
4 8 (3.45%) Google
4 8 (3.45%) iManage
4 8 (3.45%) OpenAI
5 6 (2.59%) SAP
6 5 (2.16%) Adobe
7 4 (1.72%) Apple
7 4 (1.72%) Atlassian
7 4 (1.72%) InterSystems
7 4 (1.72%) Jaspersoft
7 4 (1.72%) ServiceNow
8 2 (0.86%) BeyondTrust
8 2 (0.86%) CyberArk
8 2 (0.86%) Informatica
8 2 (0.86%) Remedy
8 2 (0.86%) Salesforce