Video Conferencing Jobs in the City of London

Videoconferencing
Central London > City of London

The table below looks at the prevalence of the term Video Conferencing in permanent job vacancies advertised in the City of London. Included is a benchmarking guide to the salaries offered in vacancies that have cited Video Conferencing over the 6 months to 27 April 2024 with a comparison to the same period over the previous 2 years.

6 months to
27 Apr 2024
Same period 2023 Same period 2022
Rank 111 207 267
Rank change year-on-year +96 +60 -45
Permanent jobs citing Video Conferencing 68 28 18
As % of all permanent jobs advertised in the City of London 2.02% 0.59% 0.26%
As % of the Miscellaneous category 6.09% 1.44% 0.60%
Number of salaries quoted 43 21 12
10th Percentile £27,950 £31,250 £30,290
25th Percentile £31,250 £32,500 £35,188
Median annual salary (50th Percentile) £37,500 £40,500 £47,222
Median % change year-on-year -7.41% -14.23% +9.82%
75th Percentile £51,250 £72,500 £61,250
90th Percentile £52,500 - £108,500
Central London median annual salary £39,000 £40,000 £47,222
% change year-on-year -2.50% -15.29% +10.46%

All Generic Skills
City of London

Video Conferencing is in the General and Transferable Skills category. The following table is for comparison with the above and provides summary statistics for all permanent job vacancies advertised in the City of London with a requirement for generic IT skills.

Permanent vacancies with a requirement for generic IT skills 1,116 1,946 3,003
As % of all permanent jobs advertised in the City of London 33.22% 40.75% 42.63%
Number of salaries quoted 880 1,635 2,417
10th Percentile £40,450 £43,397 £48,750
25th Percentile £51,625 £58,625 £60,000
Median annual salary (50th Percentile) £75,000 £77,500 £77,500
Median % change year-on-year -3.23% - +3.33%
75th Percentile £97,500 £102,500 £100,000
90th Percentile £117,500 £120,000 £115,000
Central London median annual salary £72,500 £77,500 £75,000
% change year-on-year -6.45% +3.33% -

Video Conferencing
Job Vacancy Trend in the City of London

Job postings citing Video Conferencing as a proportion of all IT jobs advertised in the City of London.
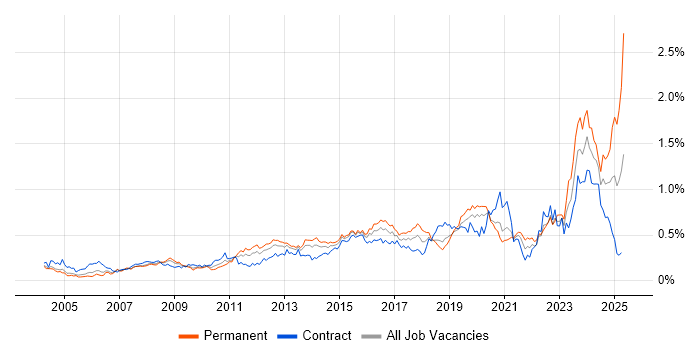
Job vacancy trend for Video Conferencing in the City of London

Video Conferencing
Salary Trend in the City of London

3-month moving average salary quoted in jobs citing Video Conferencing in the City of London.

Salary trend for Video Conferencing in the City of London

Video Conferencing
Salary Histogram in the City of London

Salary distribution for jobs citing Video Conferencing in the City of London over the 6 months to 27 April 2024.

Salary histogram for Video Conferencing in the City of London

Video Conferencing
Co-occurring Skills and Capabilities in the City of London by Category

The follow tables expand on the table above by listing co-occurrences grouped by category. The same employment type, locality and period is covered with up to 20 co-occurrences shown in each of the following categories:

Application Platforms
1 25 (36.76%) Skype for Business
2 7 (10.29%) Microsoft Exchange
3 3 (4.41%) SharePoint
Applications
1 40 (58.82%) Microsoft Office
2 5 (7.35%) Microsoft Excel
2 5 (7.35%) Microsoft PowerPoint
Business Applications
1 3 (4.41%) Carpe Diem
Cloud Services
1 42 (61.76%) Microsoft 365
2 11 (16.18%) Google Workspace
3 7 (10.29%) Azure
4 3 (4.41%) WhatsApp
5 2 (2.94%) Azure Sentinel
5 2 (2.94%) Entra ID
6 1 (1.47%) AWS
6 1 (1.47%) GCP
6 1 (1.47%) Google Drive
6 1 (1.47%) Mimecast
Communications & Networking
1 27 (39.71%) Cisco IOS
1 27 (39.71%) Skype
2 24 (35.29%) Telepresence
3 10 (14.71%) Firewall
4 8 (11.76%) Broadband
4 8 (11.76%) DNS
4 8 (11.76%) NAS
4 8 (11.76%) Wi-Fi
4 8 (11.76%) Wireless
5 7 (10.29%) WebEx
6 6 (8.82%) WAN
7 5 (7.35%) LAN
7 5 (7.35%) VPN
8 2 (2.94%) SD-WAN
9 1 (1.47%) VoIP
General
1 29 (42.65%) Finance
2 28 (41.18%) Telecoms
3 24 (35.29%) Automotive
3 24 (35.29%) Pharmaceutical
4 17 (25.00%) Social Skills
5 14 (20.59%) Analytical Skills
6 11 (16.18%) Law
7 10 (14.71%) Games
8 8 (11.76%) Legal
9 4 (5.88%) Multimedia
10 2 (2.94%) Banking
10 2 (2.94%) Marketing
10 2 (2.94%) Organisational Skills
11 1 (1.47%) Advertising
Job Titles
1 31 (45.59%) Support Engineer
2 17 (25.00%) IT Support
3 15 (22.06%) Analyst
4 14 (20.59%) Support Analyst
5 11 (16.18%) Audio Visual Technician
6 10 (14.71%) 2nd Line Support
6 10 (14.71%) IT Analyst
6 10 (14.71%) IT Support Analyst
7 8 (11.76%) Consultant
7 8 (11.76%) IT Consultant
7 8 (11.76%) IT Engineer
7 8 (11.76%) IT Support Engineer
8 7 (10.29%) Graduate
8 7 (10.29%) Graduate Support Engineer
9 6 (8.82%) 2nd Line Engineer
9 6 (8.82%) 2nd Line Support Engineer
9 6 (8.82%) Service Analyst
9 6 (8.82%) Service Desk Analyst
9 6 (8.82%) Support Specialist
10 5 (7.35%) Service Desk Support Analyst
Miscellaneous
1 8 (11.76%) Onboarding
2 4 (5.88%) Video\Live Streaming
Operating Systems
1 58 (85.29%) Windows
2 38 (55.88%) Windows 10
3 26 (38.24%) Windows 7
4 18 (26.47%) Windows Server
5 10 (14.71%) Mac OS
6 4 (5.88%) Apple iOS
7 3 (4.41%) Windows Server 2016
8 2 (2.94%) Android
8 2 (2.94%) Linux
8 2 (2.94%) Mac OS X
8 2 (2.94%) Windows Server 2019
Processes & Methodologies
1 32 (47.06%) ITIL
2 15 (22.06%) Stakeholder Management
3 11 (16.18%) Problem-Solving
4 9 (13.24%) Cybersecurity
4 9 (13.24%) Mobile Device Management
5 8 (11.76%) Asset Management
5 8 (11.76%) Business Continuity
5 8 (11.76%) Data Protection
5 8 (11.76%) Identity Management
5 8 (11.76%) IT Audit
5 8 (11.76%) Penetration Testing
5 8 (11.76%) Vulnerability Scanning
6 7 (10.29%) Customer Service
7 6 (8.82%) ITSM
8 4 (5.88%) Data Management
8 4 (5.88%) Document Management
8 4 (5.88%) Tech Ops
9 2 (2.94%) Break/Fix
9 2 (2.94%) SIEM
10 1 (1.47%) Ticket Management
Programming Languages
1 8 (11.76%) Bash
Qualifications
1 29 (42.65%) Degree
2 24 (35.29%) ITIL Foundation Certificate
2 24 (35.29%) Master's Degree
2 24 (35.29%) MBA
3 4 (5.88%) A+ Certification
4 1 (1.47%) ITIL Certification
4 1 (1.47%) Microsoft Certification
Quality Assurance & Compliance
1 9 (13.24%) ISO/IEC 27001
2 8 (11.76%) Cyber Essentials
2 8 (11.76%) SOC 2
3 1 (1.47%) SLA
System Software
1 15 (22.06%) Active Directory
2 10 (14.71%) VMware Infrastructure
3 1 (1.47%) Virtual Desktop
Systems Management
1 8 (11.76%) Single Sign-On
2 4 (5.88%) Jamf Pro
2 4 (5.88%) Microsoft Intune
3 2 (2.94%) SCCM
3 2 (2.94%) ZENworks
4 1 (1.47%) AirWatch
4 1 (1.47%) WMI
Vendors
1 54 (79.41%) Microsoft
2 34 (50.00%) Apple
2 34 (50.00%) Cisco
3 25 (36.76%) Polycom
4 11 (16.18%) Google
5 10 (14.71%) VMware
6 4 (5.88%) Adobe
6 4 (5.88%) Citrix
6 4 (5.88%) iManage
7 2 (2.94%) HP
7 2 (2.94%) Kofax
7 2 (2.94%) ServiceNow
8 1 (1.47%) Intapp
8 1 (1.47%) NEC