Dynamics 365 Job Trends in the North of England

Microsoft Dynamics 365 (D365)
England > North of England

The table below provides summary statistics and salary benchmarking for jobs advertised in the North of England requiring Dynamics 365 skills. It covers permanent job vacancies from the 6 months leading up to 19 November 2025, with comparisons to the same periods in the previous two years.

6 months to
19 Nov 2025
Same period 2024 Same period 2023
Rank 143 127 190
Rank change year-on-year -16 +63 +139
Permanent jobs citing Dynamics 365 127 215 95
As % of all permanent jobs in the North of England 1.32% 1.76% 1.26%
As % of the Cloud Services category 4.22% 6.10% 2.89%
Number of salaries quoted 111 162 82
10th Percentile £43,750 £45,000 £41,400
25th Percentile £58,125 £50,313 £45,000
Median annual salary (50th Percentile) £70,000 £65,000 £55,000
Median % change year-on-year +7.69% +18.18% -13.88%
75th Percentile £80,000 £80,000 £67,500
90th Percentile £90,000 £100,000 £87,500
England median annual salary £65,000 £65,000 £60,000
% change year-on-year - +8.33% -3.23%

All Cloud Skills
North of England

Dynamics 365 falls under the Cloud Services category. For comparison with the information above, the following table provides summary statistics for all permanent job vacancies requiring cloud computing skills in the North of England.

Permanent vacancies with a requirement for cloud computing skills 3,013 3,522 3,283
As % of all permanent jobs advertised in the North of England 31.31% 28.85% 43.64%
Number of salaries quoted 1,882 1,969 2,699
10th Percentile £28,000 £32,500 £30,000
25th Percentile £34,000 £42,500 £41,250
Median annual salary (50th Percentile) £55,000 £55,000 £55,000
75th Percentile £71,250 £70,000 £71,625
90th Percentile £83,400 £83,800 £84,056
England median annual salary £57,500 £65,000 £62,500
% change year-on-year -11.54% +4.00% -3.85%

Dynamics 365
Job Vacancy Trend in the North of England

Historical trend showing the proportion of permanent IT job postings citing Dynamics 365 relative to all permanent IT jobs advertised in the North of England.
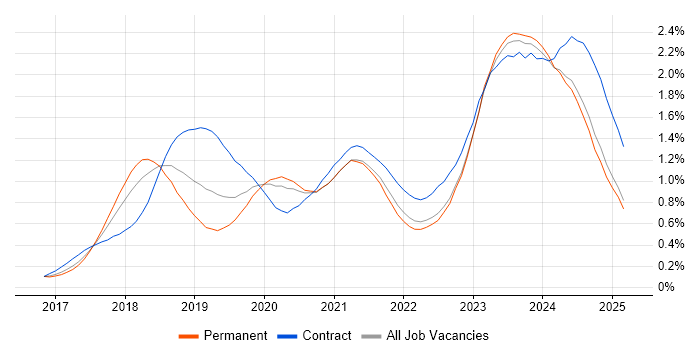
Dynamics 365 job vacancy trend in the North of England

Dynamics 365
Salary Trend in the North of England

Salary distribution trend for jobs in the North of England citing Dynamics 365.

Salary distribution trend for jobs in the North of England citing Dynamics 365

Dynamics 365
Salary Histogram in the North of England

Salary distribution for jobs citing Dynamics 365 in the North of England over the 6 months to 19 November 2025.

Salary histogram for Dynamics 365 in the North of England

Dynamics 365
Job Locations in the North of England

The table below looks at the demand and provides a guide to the median salaries quoted in IT jobs citing Dynamics 365 within the North of England region over the 6 months to 19 November 2025. The 'Rank Change' column provides an indication of the change in demand within each location based on the same 6 month period last year.

Location Rank Change
on Same Period
Last Year
Matching
Permanent
IT Job Ads
Median Salary
Past 6 Months
Median Salary
% Change
on Same Period
Last Year
Live
Jobs
North West -6 84 £65,000 - 46
Yorkshire -23 34 £70,000 - 21
North East -10 9 £65,000 -13.33% 1
Dynamics 365
England

Dynamics 365
Co-Occurring Skills & Capabilities in the North of England by Category

The following tables expand on the one above by listing co-occurrences grouped by category. They cover the same employment type, locality and period, with up to 20 co-occurrences shown in each category:

Application Platforms
1 8 (6.30%) SharePoint
2 5 (3.94%) WordPress
3 2 (1.57%) CMS
4 1 (0.79%) Microsoft Exchange
4 1 (0.79%) Umbraco
Applications
1 1 (0.79%) Microsoft Office
Business Applications
1 27 (21.26%) Dynamics CRM
2 4 (3.15%) Dynamics NAV
3 2 (1.57%) Dynamics AX
4 1 (0.79%) NetSuite
4 1 (0.79%) Payment Gateway
4 1 (0.79%) Sparx Enterprise Architect
Cloud Services
1 57 (44.88%) Power Platform
2 29 (22.83%) Azure
3 24 (18.90%) Power Automate
4 16 (12.60%) PowerApps
5 11 (8.66%) Microsoft 365
6 6 (4.72%) Entra ID
6 6 (4.72%) OneDrive
7 5 (3.94%) AWS
7 5 (3.94%) Azure DevOps
7 5 (3.94%) Cloud Computing
7 5 (3.94%) GitHub
8 4 (3.15%) Azure Logic Apps
8 4 (3.15%) Microsoft Copilot
8 4 (3.15%) SaaS
9 2 (1.57%) Azure Pipelines
9 2 (1.57%) Azure Service Bus
10 1 (0.79%) Azure Synapse Analytics
10 1 (0.79%) BigCommerce
10 1 (0.79%) GitHub Actions
10 1 (0.79%) Google Docs
Communications & Networking
1 1 (0.79%) Intranet
Database & Business Intelligence
1 16 (12.60%) Power BI
2 6 (4.72%) SQL Server
3 4 (3.15%) Data Lake
4 2 (1.57%) Azure SQL Database
5 1 (0.79%) Crystal Reports
5 1 (0.79%) Data Warehouse
5 1 (0.79%) SQL Server Reporting Services
Development Applications
1 1 (0.79%) Git
1 1 (0.79%) Selenium
General
1 26 (20.47%) Finance
2 21 (16.54%) Social Skills
3 15 (11.81%) Tech for Good
4 8 (6.30%) Analytical Skills
4 8 (6.30%) Law
5 7 (5.51%) Manufacturing
5 7 (5.51%) Retail
6 4 (3.15%) Public Sector
7 3 (2.36%) Financial Institution
8 2 (1.57%) Back Office
8 2 (1.57%) Documentation Skills
8 2 (1.57%) Organisational Skills
9 1 (0.79%) Inclusion and Diversity
9 1 (0.79%) Influencing Skills
Job Titles
1 22 (17.32%) Lead
2 19 (14.96%) Consultant
2 19 (14.96%) Dynamics 365 Consultant
3 16 (12.60%) Developer
4 15 (11.81%) Application Development Manager
4 15 (11.81%) Applications Development Manager
4 15 (11.81%) Applications Manager
4 15 (11.81%) Architect
4 15 (11.81%) Development Manager
5 12 (9.45%) Dynamics 365 Architect
6 11 (8.66%) Senior
7 8 (6.30%) Analyst
7 8 (6.30%) Data Migration Lead
8 7 (5.51%) Platform Engineer
9 6 (4.72%) Power Platform Developer
9 6 (4.72%) Power Platform Engineer
10 5 (3.94%) Applications Support
10 5 (3.94%) Dynamics 365 Developer
10 5 (3.94%) IT Support
10 5 (3.94%) Support Officer
Libraries, Frameworks & Software Standards
1 7 (5.51%) HTML
2 6 (4.72%) .NET
3 2 (1.57%) ASP.NET Web API
3 2 (1.57%) CSS
3 2 (1.57%) OAuth
3 2 (1.57%) OAuth2
3 2 (1.57%) XML
4 1 (0.79%) AngularJS
4 1 (0.79%) ASP.NET
4 1 (0.79%) ASP.NET MVC
4 1 (0.79%) CSS3
4 1 (0.79%) EDI
4 1 (0.79%) HTML5
4 1 (0.79%) PySpark
4 1 (0.79%) Razor View Engine
4 1 (0.79%) React
4 1 (0.79%) REST
4 1 (0.79%) RESTful
4 1 (0.79%) SOAP
4 1 (0.79%) Vue
Miscellaneous
1 7 (5.51%) Onboarding
2 5 (3.94%) Video Conferencing
3 2 (1.57%) Analytical Mindset
3 2 (1.57%) Driving Licence
3 2 (1.57%) Hybrid Cloud
3 2 (1.57%) Life Science
3 2 (1.57%) Low-Code
3 2 (1.57%) Management Information System
3 2 (1.57%) NHS
4 1 (0.79%) AI Agents
4 1 (0.79%) Blog
4 1 (0.79%) Enterprise Software
4 1 (0.79%) Legacy Applications
4 1 (0.79%) Mobile App
4 1 (0.79%) Product Ownership
4 1 (0.79%) Social Media
Operating Systems
1 5 (3.94%) Windows
1 5 (3.94%) Windows 10
2 2 (1.57%) VMS
Processes & Methodologies
1 35 (27.56%) ERP
2 28 (22.05%) CRM
3 26 (20.47%) Agile
4 19 (14.96%) Business Intelligence
5 15 (11.81%) Problem-Solving
6 12 (9.45%) Migration
6 12 (9.45%) Process Improvement
7 11 (8.66%) CI/CD
7 11 (8.66%) Continuous Improvement
7 11 (8.66%) DevOps
8 10 (7.87%) Project Management
9 9 (7.09%) Cybersecurity
9 9 (7.09%) Data Migration
10 8 (6.30%) Digital Transformation Programme
10 8 (6.30%) ITIL
10 8 (6.30%) Platform Engineering
10 8 (6.30%) Stakeholder Management
11 7 (5.51%) Computer Science
11 7 (5.51%) IT Strategy
11 7 (5.51%) Project Delivery
Programming Languages
1 13 (10.24%) SQL
2 8 (6.30%) C#
3 4 (3.15%) C
3 4 (3.15%) JavaScript
4 2 (1.57%) Java
5 1 (0.79%) PL/SQL
5 1 (0.79%) Python
Qualifications
1 16 (12.60%) SC Cleared
1 16 (12.60%) Security Cleared
2 11 (8.66%) Degree
3 5 (3.94%) A+ Certification
3 5 (3.94%) Microsoft Certification
4 4 (3.15%) Computer Science Degree
5 2 (1.57%) Master's Degree
6 1 (0.79%) Azure Certification
6 1 (0.79%) BPSS Clearance
6 1 (0.79%) CBAP
6 1 (0.79%) MCP
Quality Assurance & Compliance
1 6 (4.72%) Cyber Essentials
2 5 (3.94%) Cyber Essentials PLUS
3 2 (1.57%) GDPR
3 2 (1.57%) ISO 9001
3 2 (1.57%) ISO/IEC 27001
4 1 (0.79%) Accessibility
4 1 (0.79%) Data Quality
4 1 (0.79%) PMO
4 1 (0.79%) QA
System Software
1 2 (1.57%) Virtual Machines
2 1 (0.79%) Active Directory
2 1 (0.79%) Hyper-V
Systems Management
1 9 (7.09%) Microsoft Intune
2 4 (3.15%) SCCM
3 1 (0.79%) Single Sign-On
Vendors
1 89 (70.08%) Microsoft
2 4 (3.15%) Blue Prism
2 4 (3.15%) Databricks
2 4 (3.15%) Facebook
2 4 (3.15%) UiPath
3 2 (1.57%) Salesforce
4 1 (0.79%) BiZZdesign
4 1 (0.79%) Cisco
4 1 (0.79%) Google
4 1 (0.79%) Meraki
4 1 (0.79%) Oracle
4 1 (0.79%) ServiceNow
4 1 (0.79%) Sparx
4 1 (0.79%) Workday