Stakeholder Management Jobs in the North of England

Stakeholder Management
England > North of England

The table below provides summary statistics for permanent job vacancies advertised in the North of England requiring Stakeholder Management skills. It includes a benchmarking guide to the annual salaries offered in vacancies that cited Stakeholder Management over the 6 months leading up to 31 May 2025, comparing them to the same period in the previous two years.

6 months to
31 May 2025
Same period 2024 Same period 2023
Rank 44 48 56
Rank change year-on-year +4 +8 -18
Permanent jobs citing Stakeholder Management 714 722 930
As % of all permanent jobs advertised in the North of England 6.07% 3.91% 5.68%
As % of the Processes & Methodologies category 6.45% 4.79% 5.87%
Number of salaries quoted 452 538 589
10th Percentile £42,500 £33,750 £38,813
25th Percentile £54,793 £41,250 £45,000
Median annual salary (50th Percentile) £58,500 £57,500 £55,000
Median % change year-on-year +1.74% +4.55% +8.91%
75th Percentile £68,750 £72,500 £68,250
90th Percentile £82,500 £84,964 £86,250
England median annual salary £63,900 £62,500 £65,000
% change year-on-year +2.24% -3.85% +4.00%

All Process and Methodology Skills
North of England

Stakeholder Management falls under the Processes and Methodologies category. For comparison with the information above, the following table provides summary statistics for all permanent job vacancies requiring process or methodology skills in the North of England.

Permanent vacancies with a requirement for process or methodology skills 11,078 15,074 15,835
As % of all permanent jobs advertised in the North of England 94.14% 81.62% 96.71%
Number of salaries quoted 5,542 11,471 7,791
10th Percentile £25,087 £27,500 £31,250
25th Percentile £36,250 £36,750 £40,000
Median annual salary (50th Percentile) £50,055 £50,000 £55,000
Median % change year-on-year +0.11% -9.09% +10.00%
75th Percentile £61,967 £65,000 £70,000
90th Percentile £77,500 £79,250 £81,250
England median annual salary £57,500 £55,000 £62,500
% change year-on-year +4.55% -12.00% +4.17%

Stakeholder Management
Job Vacancy Trend in the North of England

Job postings citing Stakeholder Management as a proportion of all IT jobs advertised in the North of England.
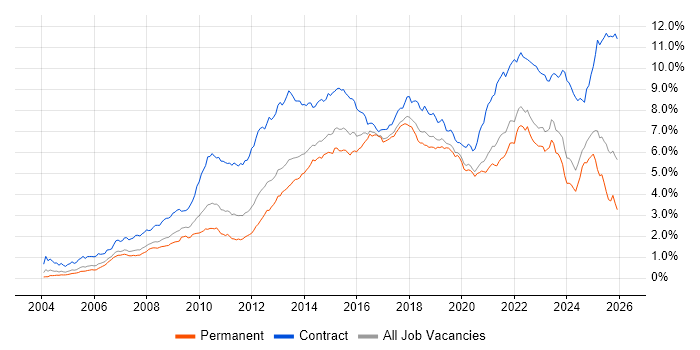
Job vacancy trend for Stakeholder Management in the North of England

Stakeholder Management
Salary Trend in the North of England

3-month moving average salary quoted in jobs citing Stakeholder Management in the North of England.

Salary trend for Stakeholder Management in the North of England

Stakeholder Management
Salary Histogram in the North of England

Salary distribution for jobs citing Stakeholder Management in the North of England over the 6 months to 31 May 2025.

Salary histogram for Stakeholder Management in the North of England

Stakeholder Management
Job Locations in the North of England

The table below looks at the demand and provides a guide to the median salaries quoted in IT jobs citing Stakeholder Management within the North of England region over the 6 months to 31 May 2025. The 'Rank Change' column provides an indication of the change in demand within each location based on the same 6 month period last year.

Location Rank Change
on Same Period
Last Year
Matching
Permanent
IT Job Ads
Median Salary
Past 6 Months
Median Salary
% Change
on Same Period
Last Year
Live
Jobs
North West +11 520 £58,500 +8.33% 246
Yorkshire -1 169 £61,250 -0.38% 115
North East +15 25 £45,000 -22.37% 41
Stakeholder Management
England

Stakeholder Management
Co-occurring Skills and Capabilities in the North of England by Category

The follow tables expand on the table above by listing co-occurrences grouped by category. The same employment type, locality and period is covered with up to 20 co-occurrences shown in each of the following categories:

Application Platforms
1 49 (6.86%) Confluence
2 8 (1.12%) SharePoint
3 3 (0.42%) IIS
4 2 (0.28%) nginx
4 2 (0.28%) SAS
5 1 (0.14%) Apache Airflow
5 1 (0.14%) Apache Spark
5 1 (0.14%) CMS
5 1 (0.14%) Moodle
5 1 (0.14%) NetWeaver
Applications
1 49 (6.86%) Microsoft Office
2 21 (2.94%) Microsoft Excel
3 15 (2.10%) Microsoft Project
4 14 (1.96%) Microsoft PowerPoint
5 8 (1.12%) MS Visio
6 7 (0.98%) Trello
7 5 (0.70%) Spreadsheet
8 2 (0.28%) Chatbot
9 1 (0.14%) AutoCAD
9 1 (0.14%) SPSS
Business Applications
1 3 (0.42%) NetSuite
1 3 (0.42%) Shopify
2 2 (0.28%) SAP S/4HANA
3 1 (0.14%) Distributed Ledger
3 1 (0.14%) Dynamics CRM
3 1 (0.14%) Dynamics NAV
3 1 (0.14%) Infor SunSystems
3 1 (0.14%) Magento
3 1 (0.14%) Oracle EBS
3 1 (0.14%) Oracle ERP
3 1 (0.14%) Oracle Payroll
3 1 (0.14%) Salesforce CRM
3 1 (0.14%) SAP GRC
3 1 (0.14%) SAP MDG
Cloud Services
1 57 (7.98%) Azure
2 29 (4.06%) AWS
3 27 (3.78%) Power Platform
4 19 (2.66%) GCP
5 18 (2.52%) Microsoft 365
6 13 (1.82%) GitHub
7 9 (1.26%) Entra ID
8 8 (1.12%) Azure DevOps
9 7 (0.98%) GitHub Actions
10 5 (0.70%) Dynamics 365
11 4 (0.56%) Azure Data Factory
11 4 (0.56%) Azure Logic Apps
12 3 (0.42%) Figma
12 3 (0.42%) Miro
12 3 (0.42%) Nutanix
12 3 (0.42%) PowerApps
13 2 (0.28%) Amazon EKS
13 2 (0.28%) OCI
13 2 (0.28%) Power Automate
13 2 (0.28%) Serverless
Communications & Networking
1 4 (0.56%) Network Security
1 4 (0.56%) VPN
2 3 (0.42%) Firewall
2 3 (0.42%) WAN
3 2 (0.28%) Cisco ISE
3 2 (0.28%) DHCP
3 2 (0.28%) DNS
3 2 (0.28%) Reverse Proxy
3 2 (0.28%) SD-WAN
3 2 (0.28%) Software-Defined Networking
3 2 (0.28%) TACACS
3 2 (0.28%) Wi-Fi
4 1 (0.14%) BGP
4 1 (0.14%) Cisco ASA
4 1 (0.14%) Cisco Firepower
4 1 (0.14%) EIGRP
4 1 (0.14%) HSRP
4 1 (0.14%) Junos
4 1 (0.14%) NAS
4 1 (0.14%) OSPF
Database & Business Intelligence
1 23 (3.22%) Power BI
2 10 (1.40%) Tableau
3 8 (1.12%) MongoDB
4 5 (0.70%) Data Warehouse
4 5 (0.70%) PostgreSQL
5 4 (0.56%) NoSQL
5 4 (0.56%) Redis
6 3 (0.42%) Azure SQL Database
6 3 (0.42%) Data Lake
6 3 (0.42%) Hazelcast
6 3 (0.42%) MySQL
6 3 (0.42%) SQL Server
7 2 (0.28%) Relational Database
7 2 (0.28%) SQL Server Integration Services
8 1 (0.14%) BusinessObjects
8 1 (0.14%) Looker
8 1 (0.14%) Oracle Exadata
8 1 (0.14%) Oracle Reports
8 1 (0.14%) SAP Data Services
8 1 (0.14%) SAP HANA
Development Applications
1 41 (5.74%) JIRA
2 27 (3.78%) Rational DOORS
3 6 (0.84%) CircleCI
4 4 (0.56%) Cucumber
4 4 (0.56%) Git
4 4 (0.56%) GitLab
4 4 (0.56%) Jenkins
4 4 (0.56%) Selenium
5 2 (0.28%) SQL Server Management Studio (SSMS)
6 1 (0.14%) Cypress.io
6 1 (0.14%) IBM UrbanCode
6 1 (0.14%) MLflow
6 1 (0.14%) Octopus Deploy
6 1 (0.14%) Team Foundation Server
6 1 (0.14%) TeamCity
6 1 (0.14%) Travis CI
6 1 (0.14%) webpack
General
1 199 (27.87%) Social Skills
2 189 (26.47%) Finance
3 76 (10.64%) Manufacturing
4 74 (10.36%) Analytical Skills
5 32 (4.48%) Banking
6 30 (4.20%) Public Sector
7 29 (4.06%) Organisational Skills
8 27 (3.78%) Presentation Skills
9 19 (2.66%) Financial Institution
10 16 (2.24%) Aviation
10 16 (2.24%) Retail
11 14 (1.96%) Law
12 13 (1.82%) Automotive
13 12 (1.68%) Legal
14 10 (1.40%) Inclusion and Diversity
14 10 (1.40%) Influencing Skills
15 7 (0.98%) Marketing
16 6 (0.84%) Documentation Skills
17 4 (0.56%) Advertising
17 4 (0.56%) Mandarin Language
Job Titles
1 168 (23.53%) Project Manager
2 97 (13.59%) Delivery Project Manager
3 95 (13.31%) Engineering Manager
4 91 (12.75%) Senior
5 56 (7.84%) Analyst
6 40 (5.60%) Lead
7 36 (5.04%) Senior Systems Engineer
7 36 (5.04%) Systems Engineer
8 31 (4.34%) Delivery Manager
9 29 (4.06%) Senior Manager
10 28 (3.92%) Architect
11 27 (3.78%) Requirements Manager
12 25 (3.50%) Business Manager
13 21 (2.94%) Security Engineer
14 20 (2.80%) Senior Security Engineer
15 19 (2.66%) Business Analyst
15 19 (2.66%) IT Manager
15 19 (2.66%) Senior Project Manager
16 18 (2.52%) Solutions Architect
16 18 (2.52%) Technical Manager
Libraries, Frameworks & Software Standards
1 17 (2.38%) .NET
2 16 (2.24%) React
3 14 (1.96%) AngularJS
4 10 (1.40%) .NET Core
5 7 (0.98%) HTML
6 6 (0.84%) CSS
6 6 (0.84%) Kafka
7 5 (0.70%) Node.js
7 5 (0.70%) Oracle Fusion
7 5 (0.70%) Spring
8 4 (0.56%) SailPoint
8 4 (0.56%) Spring Boot
9 3 (0.42%) Middleware
9 3 (0.42%) React Native
9 3 (0.42%) RESTful
9 3 (0.42%) WebSockets
10 2 (0.28%) 802.1X
10 2 (0.28%) JSON
10 2 (0.28%) REST
10 2 (0.28%) XML
Miscellaneous
1 36 (5.04%) Product Ownership
2 34 (4.76%) Management Information System
3 10 (1.40%) Analytical Mindset
4 9 (1.26%) Credit Risk
5 8 (1.12%) Driving Licence
5 8 (1.12%) Public Cloud
6 6 (0.84%) Distributed Systems
6 6 (0.84%) NHS
6 6 (0.84%) Self-Motivation
6 6 (0.84%) Social Media
7 5 (0.70%) Wiki
8 4 (0.56%) Hybrid Cloud
8 4 (0.56%) Legacy Systems
8 4 (0.56%) Life Science
8 4 (0.56%) Onboarding
8 4 (0.56%) Operational Technology
9 3 (0.42%) Client/Server
9 3 (0.42%) Mobile App
9 3 (0.42%) Security Posture
9 3 (0.42%) Virtual Team
Operating Systems
1 25 (3.50%) Windows
2 8 (1.12%) Windows Server
3 6 (0.84%) Windows Vista
4 4 (0.56%) Linux
5 2 (0.28%) CentOS
5 2 (0.28%) Windows Server 2016
6 1 (0.14%) Unix
6 1 (0.14%) zOS
Processes & Methodologies
1 198 (27.73%) Project Management
2 178 (24.93%) Agile
3 147 (20.59%) Project Delivery
4 141 (19.75%) Systems Engineering
5 119 (16.67%) Risk Management
6 89 (12.46%) Validation
7 82 (11.48%) Problem-Solving
7 82 (11.48%) Verification and Validation
8 67 (9.38%) Project Planning
9 66 (9.24%) ERP
10 64 (8.96%) Business Strategy
11 63 (8.82%) Roadmaps
12 60 (8.40%) Business Case
13 57 (7.98%) Continuous Improvement
13 57 (7.98%) ITIL
14 48 (6.72%) DevOps
15 47 (6.58%) Line Management
16 46 (6.44%) Cybersecurity
17 43 (6.02%) Budget Management
18 42 (5.88%) Decision-Making
Programming Languages
1 29 (4.06%) SQL
2 20 (2.80%) Python
3 18 (2.52%) JavaScript
4 15 (2.10%) C#
5 9 (1.26%) Java
5 9 (1.26%) TypeScript
6 7 (0.98%) R
7 5 (0.70%) Data Analysis Expressions
8 4 (0.56%) PowerShell
9 2 (0.28%) Kotlin
10 1 (0.14%) PHP
10 1 (0.14%) VB.NET
Qualifications
1 313 (43.84%) BPSS Clearance
2 156 (21.85%) Degree
3 59 (8.26%) Master's Degree
4 55 (7.70%) Chartered Engineer
5 26 (3.64%) PMP
6 16 (2.24%) APMP
7 15 (2.10%) HND
8 13 (1.82%) DBS Check
8 13 (1.82%) Security Cleared
9 11 (1.54%) CRISC
10 10 (1.40%) SC Cleared
11 9 (1.26%) CISSP
11 9 (1.26%) PMI Certification
12 7 (0.98%) Computer Science Degree
13 5 (0.70%) CISM
14 4 (0.56%) Azure Certification
15 3 (0.42%) AWS Certification
15 3 (0.42%) AWS Certified Solutions Architect
15 3 (0.42%) Cisco Certification
15 3 (0.42%) TOGAF Certification
Quality Assurance & Compliance
1 14 (1.96%) QA
2 12 (1.68%) ISO/IEC 27001
3 11 (1.54%) NIST
4 9 (1.26%) COBIT
4 9 (1.26%) GRC
4 9 (1.26%) Sarbanes-Oxley
5 7 (0.98%) Data Quality
5 7 (0.98%) PMO
6 5 (0.70%) ISO 20022
7 4 (0.56%) Accessibility
7 4 (0.56%) GDPR
7 4 (0.56%) ITGC
7 4 (0.56%) PCI DSS
8 2 (0.28%) SEPA
9 1 (0.14%) California Consumer Privacy Act
9 1 (0.14%) Cyber Essentials
9 1 (0.14%) Cyber Essentials PLUS
9 1 (0.14%) HIPAA
9 1 (0.14%) P3O
System Software
1 21 (2.94%) Docker
2 9 (1.26%) Active Directory
3 8 (1.12%) VMware ESXi
4 2 (0.28%) VMware NSX
5 1 (0.14%) Hyper-V
5 1 (0.14%) NFS
5 1 (0.14%) VMware Infrastructure
Systems Management
1 21 (2.94%) Kubernetes
2 10 (1.40%) Terraform
3 8 (1.12%) Microsoft Intune
4 5 (0.70%) Ansible
5 1 (0.14%) Automic
5 1 (0.14%) Consul
5 1 (0.14%) Grafana
5 1 (0.14%) Rancher
Vendors
1 107 (14.99%) Microsoft
2 55 (7.70%) SAP
3 32 (4.48%) Atlassian
4 21 (2.94%) Oracle
5 9 (1.26%) Salesforce
5 9 (1.26%) VMware
6 8 (1.12%) ServiceNow
7 7 (0.98%) Avaloq
8 6 (0.84%) Cisco
8 6 (0.84%) Concur
8 6 (0.84%) Veeam
9 5 (0.70%) Facebook
9 5 (0.70%) IBM
9 5 (0.70%) JD Edwards
9 5 (0.70%) Liquidlogic
10 4 (0.56%) Okta
11 3 (0.42%) BeyondTrust
11 3 (0.42%) CyberArk
11 3 (0.42%) Google
11 3 (0.42%) Workday