Confluence Jobs in the North of England

Confluence
England > North of England

The table below provides summary statistics for permanent job vacancies advertised in the North of England requiring Confluence skills. It includes a benchmarking guide to the annual salaries offered in vacancies that cited Confluence over the 6 months leading up to 26 July 2024, comparing them to the same period in the previous two years.

6 months to
26 Jul 2024
Same period 2023 Same period 2022
Rank 245 249 202
Rank change year-on-year +4 -47 +24
Permanent jobs citing Confluence 123 134 316
As % of all permanent jobs advertised in the North of England 0.75% 1.03% 1.65%
As % of the Application Platforms category 9.73% 11.41% 12.22%
Number of salaries quoted 91 112 165
10th Percentile £37,500 £37,885 £35,500
25th Percentile £45,000 £46,350 £42,500
Median annual salary (50th Percentile) £55,000 £60,000 £55,000
Median % change year-on-year -8.33% +9.09% +22.22%
75th Percentile £69,375 £82,548 £70,000
90th Percentile £75,772 £104,410 £77,715
England median annual salary £57,500 £65,000 £62,500
% change year-on-year -11.54% +4.00% +4.17%

All Application Platform Skills
North of England

Confluence falls under the Application Platforms category. For comparison with the information above, the following table provides summary statistics for all permanent job vacancies requiring application platform skills in the North of England.

Permanent vacancies with a requirement for application platform skills 1,264 1,174 2,585
As % of all permanent jobs advertised in the North of England 7.75% 9.04% 13.49%
Number of salaries quoted 876 955 1,530
10th Percentile £26,500 £28,250 £26,250
25th Percentile £32,688 £35,000 £32,000
Median annual salary (50th Percentile) £47,500 £47,672 £45,000
Median % change year-on-year -0.36% +5.94% +5.88%
75th Percentile £62,500 £63,500 £57,931
90th Percentile £75,772 £77,715 £73,675
England median annual salary £52,500 £57,500 £55,000
% change year-on-year -8.70% +4.55% +4.76%

Confluence
Job Vacancy Trend in the North of England

Job postings citing Confluence as a proportion of all IT jobs advertised in the North of England.
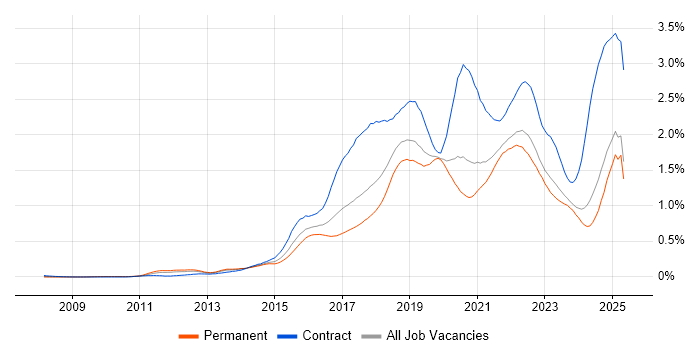
Job vacancy trend for Confluence in the North of England

Confluence
Salary Trend in the North of England

3-month moving average salary quoted in jobs citing Confluence in the North of England.

Salary trend for Confluence in the North of England

Confluence
Salary Histogram in the North of England

Salary distribution for jobs citing Confluence in the North of England over the 6 months to 26 July 2024.

Salary histogram for Confluence in the North of England

Confluence
Job Locations in the North of England

The table below looks at the demand and provides a guide to the median salaries quoted in IT jobs citing Confluence within the North of England region over the 6 months to 26 July 2024. The 'Rank Change' column provides an indication of the change in demand within each location based on the same 6 month period last year.

Location Rank Change
on Same Period
Last Year
Matching
Permanent
IT Job Ads
Median Salary
Past 6 Months
Median Salary
% Change
on Same Period
Last Year
Live
Jobs
North West +2 78 £55,000 -12.00% 5
Yorkshire +30 36 £52,500 -12.50% 6
North East -8 9 £62,783 -18.99% 2
Confluence
England

Confluence
Co-occurring Skills and Capabilities in the North of England by Category

The follow tables expand on the table above by listing co-occurrences grouped by category. The same employment type, locality and period is covered with up to 20 co-occurrences shown in each of the following categories:

Application Platforms
1 8 (6.50%) Apache Spark
2 7 (5.69%) Apache Airflow
3 6 (4.88%) SharePoint
4 3 (2.44%) CMS
5 2 (1.63%) Apache
5 2 (1.63%) Oracle SOA Suite
6 1 (0.81%) Microsoft Exchange
6 1 (0.81%) WordPress
Applications
1 9 (7.32%) MS Visio
2 2 (1.63%) Microsoft Office
2 2 (1.63%) Microsoft Project
3 1 (0.81%) Acrobat
3 1 (0.81%) Microsoft Excel
Business Applications
1 4 (3.25%) MIS ActiveH
2 2 (1.63%) BambooHR
2 2 (1.63%) iTrent
2 2 (1.63%) Temenos T24
3 1 (0.81%) Primavera
Cloud Services
1 40 (32.52%) Azure
2 29 (23.58%) AWS
3 27 (21.95%) Power Platform
4 22 (17.89%) Azure DevOps
5 15 (12.20%) AWS CloudFormation
6 13 (10.57%) GitHub
7 11 (8.94%) Miro
8 10 (8.13%) GCP
9 8 (6.50%) Azure Data Factory
10 7 (5.69%) dbt
11 5 (4.07%) Cloud Composer
11 5 (4.07%) Microsoft 365
12 4 (3.25%) Google Analytics
12 4 (3.25%) SaaS
13 3 (2.44%) Amazon EC2
13 3 (2.44%) Dynamics 365
13 3 (2.44%) Slack
13 3 (2.44%) Virtual Private Cloud
14 2 (1.63%) Boomi
14 2 (1.63%) Storyblok
Communications & Networking
1 4 (3.25%) Firewall
1 4 (3.25%) Skype
2 3 (2.44%) HTTPS
2 3 (2.44%) SSL
3 2 (1.63%) DNS
3 2 (1.63%) DSL
3 2 (1.63%) HTTP
4 1 (0.81%) VPN
Database & Business Intelligence
1 26 (21.14%) Power BI
2 16 (13.01%) Tableau
3 10 (8.13%) Data Mining
4 9 (7.32%) Data Lake
4 9 (7.32%) PostgreSQL
4 9 (7.32%) SQL Server
5 8 (6.50%) Azure SQL Database
6 7 (5.69%) BigQuery
6 7 (5.69%) Looker
7 6 (4.88%) Data Warehouse
7 6 (4.88%) Metadata
7 6 (4.88%) NoSQL
7 6 (4.88%) Relational Database
8 5 (4.07%) Qlik Sense
9 4 (3.25%) MySQL
10 3 (2.44%) Amazon RDS
11 2 (1.63%) Airbyte
11 2 (1.63%) Amazon Redshift
11 2 (1.63%) OLTP
11 2 (1.63%) SAP HANA
Development Applications
1 121 (98.37%) JIRA
2 31 (25.20%) Git
3 11 (8.94%) GitLab
4 6 (4.88%) Bitbucket
5 4 (3.25%) Postman
6 3 (2.44%) IBM UrbanCode
6 3 (2.44%) Jenkins
6 3 (2.44%) Oracle Forms
6 3 (2.44%) SonarQube
6 3 (2.44%) SQL Server Management Studio (SSMS)
6 3 (2.44%) Toad
7 2 (1.63%) Atlassian Bamboo
7 2 (1.63%) gulp
7 2 (1.63%) SoapUI
7 2 (1.63%) Subversion
8 1 (0.81%) Team Foundation Server
8 1 (0.81%) Visual Studio
General
1 49 (39.84%) Finance
2 39 (31.71%) Social Skills
3 20 (16.26%) Public Sector
4 18 (14.63%) Analytical Skills
5 7 (5.69%) Banking
6 6 (4.88%) Marketing
6 6 (4.88%) Presentation Skills
7 5 (4.07%) Influencing Skills
7 5 (4.07%) Law
7 5 (4.07%) Retail
8 4 (3.25%) Documentation Skills
8 4 (3.25%) Legal
8 4 (3.25%) Organisational Skills
9 3 (2.44%) Games
10 2 (1.63%) Pharmaceutical
11 1 (0.81%) Local Government
11 1 (0.81%) Manufacturing
11 1 (0.81%) Tech for Good
Job Titles
1 26 (21.14%) Senior
2 24 (19.51%) Lead
3 23 (18.70%) Analyst
4 14 (11.38%) Programme Manager
5 13 (10.57%) Business Analyst
6 12 (9.76%) Developer
7 11 (8.94%) Cloud Engineer
7 11 (8.94%) Data Engineer
8 9 (7.32%) Senior Data Engineer
9 8 (6.50%) Senior Analyst
10 6 (4.88%) Senior Business Analyst
10 6 (4.88%) Software Developer
11 5 (4.07%) Data Business Analyst
11 5 (4.07%) Head of Engineering
11 5 (4.07%) Platform Engineer
12 4 (3.25%) Agile Delivery Lead
12 4 (3.25%) Data Analyst
12 4 (3.25%) Product Manager
12 4 (3.25%) Scrum Master
12 4 (3.25%) Software Engineer
Libraries, Frameworks & Software Standards
1 10 (8.13%) Node.js
2 9 (7.32%) .NET
3 8 (6.50%) RESTful
3 8 (6.50%) Web Services
4 7 (5.69%) PySpark
5 5 (4.07%) .NET Framework
5 5 (4.07%) JSON
5 5 (4.07%) React
6 4 (3.25%) Kafka
6 4 (3.25%) SOAP
6 4 (3.25%) Swagger
7 3 (2.44%) AngularJS
7 3 (2.44%) ASP.NET Web API
7 3 (2.44%) AWS CDK
7 3 (2.44%) Entity Framework
7 3 (2.44%) jQuery
7 3 (2.44%) Twitter Bootstrap
7 3 (2.44%) Vue
7 3 (2.44%) WCF
7 3 (2.44%) WPF
Miscellaneous
1 13 (10.57%) Product Ownership
2 9 (7.32%) Distributed Systems
3 8 (6.50%) Enterprise Software
4 7 (5.69%) Mainframe
5 6 (4.88%) Data Structures
6 5 (4.07%) Cloud Native
6 5 (4.07%) Hybrid Cloud
6 5 (4.07%) Onboarding
7 4 (3.25%) IoT
8 3 (2.44%) Blog
8 3 (2.44%) Robotics
9 2 (1.63%) DataPower
9 2 (1.63%) Management Information System
9 2 (1.63%) Mobile App
9 2 (1.63%) NHS
9 2 (1.63%) Self-Motivation
10 1 (0.81%) Algorithms
10 1 (0.81%) Low-Code
10 1 (0.81%) Virtual Team
Operating Systems
1 7 (5.69%) Linux
2 4 (3.25%) Windows
2 4 (3.25%) Windows Server
3 3 (2.44%) Amazon Linux
3 3 (2.44%) Windows Server 2008
Processes & Methodologies
1 96 (78.05%) Agile
2 49 (39.84%) DevOps
3 32 (26.02%) Scrum
4 31 (25.20%) CI/CD
5 26 (21.14%) Analytics
6 23 (18.70%) Mentoring
7 21 (17.07%) Coaching
8 20 (16.26%) Infrastructure as Code
9 19 (15.45%) Budget Management
9 19 (15.45%) Data Governance
9 19 (15.45%) User Stories
9 19 (15.45%) Waterfall
10 18 (14.63%) Data Engineering
11 17 (13.82%) Business Analysis
11 17 (13.82%) Business Intelligence
12 16 (13.01%) Data Management
12 16 (13.01%) Project Management
12 16 (13.01%) Roadmaps
12 16 (13.01%) Time Management
12 16 (13.01%) Visualisation
Programming Languages
1 35 (28.46%) SQL
2 26 (21.14%) Python
3 14 (11.38%) C#
4 13 (10.57%) JavaScript
5 9 (7.32%) PHP
6 8 (6.50%) Java
6 8 (6.50%) Shell Script
7 7 (5.69%) PowerShell
8 6 (4.88%) Go
8 6 (4.88%) Ruby
9 5 (4.07%) Perl
10 4 (3.25%) Bash
10 4 (3.25%) TypeScript
11 3 (2.44%) PL/SQL
12 1 (0.81%) C++
12 1 (0.81%) JSX
Qualifications
1 29 (23.58%) Degree
2 9 (7.32%) Azure Certification
2 9 (7.32%) SC Cleared
2 9 (7.32%) Security Cleared
3 7 (5.69%) Computer Science Degree
4 2 (1.63%) AWS Certification
4 2 (1.63%) DBS Check
4 2 (1.63%) Master's Degree
5 1 (0.81%) APMP
5 1 (0.81%) CIPD
5 1 (0.81%) PMI Certification
5 1 (0.81%) PMP
5 1 (0.81%) PRINCE2 Practitioner
Quality Assurance & Compliance
1 9 (7.32%) Accessibility
2 6 (4.88%) Cyber Essentials
2 6 (4.88%) Data Quality
2 6 (4.88%) PCI DSS
3 5 (4.07%) NIST
3 5 (4.07%) QA
4 4 (3.25%) GDPR
4 4 (3.25%) PMO
5 3 (2.44%) ISO/IEC 27001
6 1 (0.81%) P3O
6 1 (0.81%) SLA
System Software
1 4 (3.25%) Docker
2 1 (0.81%) Active Directory
2 1 (0.81%) Firmware
Systems Management
1 20 (16.26%) Terraform
2 2 (1.63%) Ansible
2 2 (1.63%) Kubernetes
2 2 (1.63%) Single Sign-On
Vendors
1 21 (17.07%) Atlassian
2 13 (10.57%) Microsoft
3 12 (9.76%) Oracle
4 9 (7.32%) Databricks
5 8 (6.50%) Google
6 7 (5.69%) Informatica
6 7 (5.69%) Teradata
7 4 (3.25%) SAP
8 3 (2.44%) Cadence
9 2 (1.63%) IBM
9 2 (1.63%) Sage
9 2 (1.63%) TSYS
9 2 (1.63%) Workday
10 1 (0.81%) Adobe
10 1 (0.81%) Hotjar
10 1 (0.81%) MuleSoft
10 1 (0.81%) OutSystems
10 1 (0.81%) webMethods
10 1 (0.81%) Xero
10 1 (0.81%) Zoho