Microsoft Office Jobs in the North of England

Microsoft Office
England > North of England

The table below provides summary statistics for permanent job vacancies advertised in the North of England requiring Microsoft Office skills. It includes a benchmarking guide to the annual salaries offered in vacancies that cited Microsoft Office over the 6 months leading up to 19 June 2025, comparing them to the same period in the previous two years.

6 months to
19 Jun 2025
Same period 2024 Same period 2023
Rank 48 55 76
Rank change year-on-year +7 +21 -3
Permanent jobs citing Microsoft Office 642 706 674
As % of all permanent jobs advertised in the North of England 5.42% 3.44% 4.36%
As % of the Applications category 36.71% 47.70% 50.45%
Number of salaries quoted 363 507 367
10th Percentile £29,000 £22,910 £21,500
25th Percentile £36,250 £25,000 £25,000
Median annual salary (50th Percentile) £47,863 £29,500 £34,000
Median % change year-on-year +62.25% -13.24% +13.33%
75th Percentile £51,240 £38,750 £52,500
90th Percentile £56,000 £48,750 £67,500
England median annual salary £40,748 £32,500 £39,639
% change year-on-year +25.38% -18.01% +5.70%

All Software Application Skills
North of England

Microsoft Office falls under the Software Applications category. For comparison with the information above, the following table provides summary statistics for all permanent job vacancies requiring software application skills in the North of England.

Permanent vacancies with a requirement for software application skills 1,749 1,480 1,336
As % of all permanent jobs advertised in the North of England 14.76% 7.22% 8.64%
Number of salaries quoted 700 977 740
10th Percentile £26,500 £23,500 £22,000
25th Percentile £37,500 £26,250 £27,500
Median annual salary (50th Percentile) £47,683 £33,750 £36,128
Median % change year-on-year +41.28% -6.58% -2.36%
75th Percentile £51,240 £44,500 £52,500
90th Percentile £57,500 £57,500 £65,125
England median annual salary £47,500 £39,000 £45,000
% change year-on-year +21.79% -13.33% -

Microsoft Office
Job Vacancy Trend in the North of England

Job postings citing Microsoft Office as a proportion of all IT jobs advertised in the North of England.
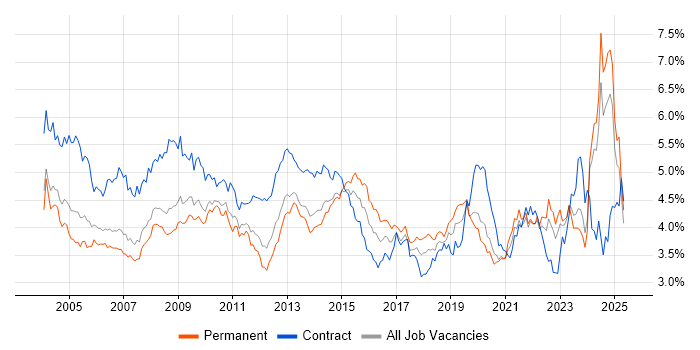
Job vacancy trend for Microsoft Office in the North of England

Microsoft Office
Salary Trend in the North of England

3-month moving average salary quoted in jobs citing Microsoft Office in the North of England.

Salary trend for Microsoft Office in the North of England

Microsoft Office
Salary Histogram in the North of England

Salary distribution for jobs citing Microsoft Office in the North of England over the 6 months to 19 June 2025.

Salary histogram for Microsoft Office in the North of England

Microsoft Office
Job Locations in the North of England

The table below looks at the demand and provides a guide to the median salaries quoted in IT jobs citing Microsoft Office within the North of England region over the 6 months to 19 June 2025. The 'Rank Change' column provides an indication of the change in demand within each location based on the same 6 month period last year.

Location Rank Change
on Same Period
Last Year
Matching
Permanent
IT Job Ads
Median Salary
Past 6 Months
Median Salary
% Change
on Same Period
Last Year
Live
Jobs
North West +22 557 £50,055 +68.25% 729
Yorkshire -49 72 £34,000 +15.25% 471
North East -4 13 £40,000 +35.59% 99
Microsoft Office
England

Microsoft Office
Co-occurring Skills and Capabilities in the North of England by Category

The follow tables expand on the table above by listing co-occurrences grouped by category. The same employment type, locality and period is covered with up to 20 co-occurrences shown in each of the following categories:

Application Platforms
1 28 (4.36%) SharePoint
2 12 (1.87%) Microsoft Exchange
3 6 (0.93%) Apache
4 1 (0.16%) Confluence
4 1 (0.16%) SharePoint Server
Applications
1 222 (34.58%) Microsoft Excel
2 189 (29.44%) Microsoft PowerPoint
3 50 (7.79%) Simulink
4 40 (6.23%) Microsoft Project
5 13 (2.02%) MS Visio
6 3 (0.47%) Spreadsheet
7 1 (0.16%) Adobe Illustrator
7 1 (0.16%) AutoCAD
7 1 (0.16%) GNU Octave
Business Applications
1 140 (21.81%) Teamcenter
2 4 (0.62%) NetSuite
3 1 (0.16%) Dynamics AX
3 1 (0.16%) Q-Pulse
3 1 (0.16%) Remedy ITSM
3 1 (0.16%) SAP CO
3 1 (0.16%) SAP FI
3 1 (0.16%) SAP FI/CO
3 1 (0.16%) SAP S/4HANA
Cloud Services
1 66 (10.28%) Microsoft 365
2 35 (5.45%) Azure
3 9 (1.40%) Power Platform
4 4 (0.62%) Google Analytics
5 3 (0.47%) Entra ID
5 3 (0.47%) Google Docs
5 3 (0.47%) Google Drive
5 3 (0.47%) Google Sheets
6 2 (0.31%) Azure DevOps
7 1 (0.16%) Asana
7 1 (0.16%) Dynamics 365
7 1 (0.16%) Google Ads
7 1 (0.16%) Google Data Studio
7 1 (0.16%) IaaS
7 1 (0.16%) Microsoft Advertising
7 1 (0.16%) Miro
7 1 (0.16%) Power Automate
7 1 (0.16%) PowerApps
Communications & Networking
1 35 (5.45%) DNS
2 28 (4.36%) DHCP
3 25 (3.89%) LAN
4 22 (3.43%) Firewall
5 19 (2.96%) TCP/IP
6 16 (2.49%) VLAN
7 15 (2.34%) VPN
7 15 (2.34%) WAN
8 10 (1.56%) Wi-Fi
9 8 (1.25%) Network Security
10 7 (1.09%) Intranet
10 7 (1.09%) Wireless
11 6 (0.93%) Cisco Nexus
11 6 (0.93%) DWDM
12 4 (0.62%) VoIP
13 2 (0.31%) Broadband
14 1 (0.16%) RTP
14 1 (0.16%) Skype
14 1 (0.16%) WLAN
Database & Business Intelligence
1 11 (1.71%) SQL Server
1 11 (1.71%) Tableau
2 9 (1.40%) Power BI
3 8 (1.25%) Big Data
3 8 (1.25%) Data Lake
3 8 (1.25%) Data Warehouse
3 8 (1.25%) NoSQL
4 6 (0.93%) MySQL
5 3 (0.47%) SQL Server Reporting Services
6 2 (0.31%) Relational Database
7 1 (0.16%) Crystal Reports
7 1 (0.16%) Power Query
7 1 (0.16%) SAP BW
Development Applications
1 6 (0.93%) Sonatype Nexus
2 3 (0.47%) JIRA
2 3 (0.47%) SQL Server Management Studio (SSMS)
3 2 (0.31%) Git
4 1 (0.16%) ClearCase
4 1 (0.16%) ClearQuest
4 1 (0.16%) Maven
4 1 (0.16%) Rational DOORS
4 1 (0.16%) Visual Studio
General
1 333 (51.87%) Social Skills
2 191 (29.75%) Aerospace
3 142 (22.12%) Automotive
4 101 (15.73%) Finance
5 58 (9.03%) Analytical Skills
6 51 (7.94%) Marketing
7 42 (6.54%) Legal
8 31 (4.83%) Manufacturing
9 30 (4.67%) Organisational Skills
10 14 (2.18%) Banking
10 14 (2.18%) Presentation Skills
11 10 (1.56%) Aeronautics
12 9 (1.40%) Inclusion and Diversity
12 9 (1.40%) Retail
13 7 (1.09%) Pharmaceutical
14 6 (0.93%) Documentation Skills
15 5 (0.78%) Advertising
16 4 (0.62%) Influencing Skills
16 4 (0.62%) Multimedia
16 4 (0.62%) Public Sector
Job Titles
1 293 (45.64%) Systems Engineer
2 89 (13.86%) Mechanical Engineer
2 89 (13.86%) Platform Engineer
3 84 (13.08%) Senior
4 68 (10.59%) Project Manager
4 68 (10.59%) Senior Systems Engineer
5 64 (9.97%) Lead
6 51 (7.94%) Team Leader
7 50 (7.79%) Lead Systems Engineer
8 48 (7.48%) IT Support
9 43 (6.70%) Analyst
10 39 (6.07%) Customer Executive
11 31 (4.83%) Assistant Project Manager
12 25 (3.89%) Integration Engineer
12 25 (3.89%) Systems Integration Engineer
13 21 (3.27%) Support Analyst
14 17 (2.65%) Support Engineer
15 16 (2.49%) Delivery Project Manager
16 15 (2.34%) Technical Support
17 13 (2.02%) Administrator
Libraries, Frameworks & Software Standards
1 2 (0.31%) .NET
2 1 (0.16%) .NET Framework
2 1 (0.16%) Drools
2 1 (0.16%) XML
Miscellaneous
1 20 (3.12%) Management Information System
2 19 (2.96%) Onboarding
3 17 (2.65%) Driving Licence
4 10 (1.56%) Renewable Energy
4 10 (1.56%) Self-Motivation
5 9 (1.40%) Product Ownership
6 8 (1.25%) EPoS
7 6 (0.93%) Public Cloud
7 6 (0.93%) Social Media
8 5 (0.78%) SCADA
9 4 (0.62%) NHS
10 3 (0.47%) Learning Management System
10 3 (0.47%) PMI
11 2 (0.31%) Algorithms
11 2 (0.31%) Data Protection Act
11 2 (0.31%) Data Structures
11 2 (0.31%) Fat Client
11 2 (0.31%) Thin Client
11 2 (0.31%) Video Conferencing
12 1 (0.16%) Foreign Exchange (FX)
Operating Systems
1 73 (11.37%) Windows
2 24 (3.74%) Windows 10
3 14 (2.18%) Windows Server
4 10 (1.56%) Windows 7
5 6 (0.93%) Windows Server 2012
5 6 (0.93%) Windows Server 2019
6 5 (0.78%) Windows 8
7 4 (0.62%) Android
7 4 (0.62%) Mac OS X
7 4 (0.62%) Windows Vista
8 3 (0.47%) Linux
9 2 (0.31%) Mac OS
9 2 (0.31%) VMS
9 2 (0.31%) Windows Server 2008
9 2 (0.31%) Windows Server 2016
10 1 (0.16%) Apple iOS
Processes & Methodologies
1 200 (31.15%) Systems Engineering
2 141 (21.96%) PLM
3 109 (16.98%) Mentoring
4 102 (15.89%) Project Management
5 99 (15.42%) Agile
6 90 (14.02%) CAD
7 77 (11.99%) Problem-Solving
8 58 (9.03%) Customer Service
9 57 (8.88%) Decision-Making
9 57 (8.88%) Line Management
10 55 (8.57%) Project Delivery
11 54 (8.41%) Business Development
11 54 (8.41%) Coaching
11 54 (8.41%) Technical Leadership
12 53 (8.26%) Safety Engineering
13 51 (7.94%) Stakeholder Management
14 50 (7.79%) ERP
14 50 (7.79%) Model-Based Systems Engineering
14 50 (7.79%) SysML
14 50 (7.79%) System Testing
Programming Languages
1 141 (21.96%) MATLAB
2 11 (1.71%) SQL
3 9 (1.40%) Java
4 6 (0.93%) JavaScript
4 6 (0.93%) PHP
4 6 (0.93%) Python
4 6 (0.93%) VB
5 5 (0.78%) VBA
6 3 (0.47%) PowerShell
7 1 (0.16%) C
7 1 (0.16%) C++
7 1 (0.16%) T-SQL
7 1 (0.16%) VBScript
Qualifications
1 383 (59.66%) BPSS Clearance
2 296 (46.11%) Degree
3 157 (24.45%) HNC
4 137 (21.34%) HND
5 20 (3.12%) DBS Check
6 10 (1.56%) Security Cleared
7 9 (1.40%) Microsoft Certification
8 8 (1.25%) CCNA
8 8 (1.25%) Cisco Certification
8 8 (1.25%) JNCIA
9 7 (1.09%) MOS
9 7 (1.09%) SC Cleared
10 6 (0.93%) ACCA
10 6 (0.93%) CCNP
10 6 (0.93%) CIMA
10 6 (0.93%) Computer Science Degree
10 6 (0.93%) JNCIS
11 3 (0.47%) A+ Certification
11 3 (0.47%) MBA
11 3 (0.47%) PMI Certification
Quality Assurance & Compliance
1 9 (1.40%) Cyber Essentials
2 8 (1.25%) SLA
3 7 (1.09%) QA
4 6 (0.93%) GDPR
5 2 (0.31%) Data Quality
6 1 (0.16%) GAAP
6 1 (0.16%) GLP
6 1 (0.16%) Good Clinical Practice
6 1 (0.16%) GxP
6 1 (0.16%) IFRS
6 1 (0.16%) ISO/IEC 27001
6 1 (0.16%) NCSC
6 1 (0.16%) PMO
System Software
1 34 (5.30%) Active Directory
2 9 (1.40%) VMware Infrastructure
3 5 (0.78%) Hyper-V
4 4 (0.62%) Virtual Desktop
5 1 (0.16%) BitLocker
5 1 (0.16%) Microsoft App-V
Systems Management
1 17 (2.65%) Microsoft Intune
2 6 (0.93%) Ansible
2 6 (0.93%) Terraform
3 1 (0.16%) Active Directory Federation Services
3 1 (0.16%) SCCM
Vendors
1 425 (66.20%) Microsoft
2 140 (21.81%) ANSYS
3 67 (10.44%) SAP
4 50 (7.79%) MathWorks
5 44 (6.85%) Salesforce
6 20 (3.12%) VMware
7 14 (2.18%) Google
8 13 (2.02%) Cisco
9 9 (1.40%) EMC
10 8 (1.25%) Citrix
11 7 (1.09%) Apple
12 6 (0.93%) Arista
13 5 (0.78%) Avaya
13 5 (0.78%) Logitech
13 5 (0.78%) MobileIron
13 5 (0.78%) Veeam
14 4 (0.62%) Adobe
14 4 (0.62%) Cognos
14 4 (0.62%) Oracle
14 4 (0.62%) ServiceNow