Microsoft Excel Jobs in the North of England

Microsoft Excel
England > North of England

The table below provides summary statistics for permanent job vacancies advertised in the North of England requiring Microsoft Excel skills. It includes a benchmarking guide to the annual salaries offered in vacancies that cited Microsoft Excel over the 6 months leading up to 26 July 2024, comparing them to the same period in the previous two years.

6 months to
26 Jul 2024
Same period 2023 Same period 2022
Rank 58 104 93
Rank change year-on-year +46 -11 +23
Permanent jobs citing Microsoft Excel 534 421 669
As % of all permanent jobs advertised in the North of England 3.28% 3.24% 3.49%
As % of the Applications category 40.33% 40.21% 38.36%
Number of salaries quoted 240 260 349
10th Percentile £23,750 £22,000 £25,000
25th Percentile £25,750 £29,000 £30,500
Median annual salary (50th Percentile) £32,500 £32,500 £39,322
Median % change year-on-year - -17.35% +7.83%
75th Percentile £43,750 £47,500 £50,000
90th Percentile £57,644 £52,629 £64,600
England median annual salary £42,500 £42,500 £46,500
% change year-on-year - -8.60% +9.41%

All Software Application Skills
North of England

Microsoft Excel falls under the Software Applications category. For comparison with the information above, the following table provides summary statistics for all permanent job vacancies requiring software application skills in the North of England.

Permanent vacancies with a requirement for software application skills 1,324 1,047 1,744
As % of all permanent jobs advertised in the North of England 8.12% 8.07% 9.10%
Number of salaries quoted 685 711 992
10th Percentile £23,750 £22,750 £23,132
25th Percentile £26,250 £27,600 £27,826
Median annual salary (50th Percentile) £35,000 £36,000 £37,634
Median % change year-on-year -2.78% -4.34% +0.36%
75th Percentile £45,000 £52,500 £48,875
90th Percentile £57,500 £67,500 £62,500
England median annual salary £40,450 £45,000 £45,000
% change year-on-year -10.11% - -

Microsoft Excel
Job Vacancy Trend in the North of England

Job postings citing Microsoft Excel as a proportion of all IT jobs advertised in the North of England.
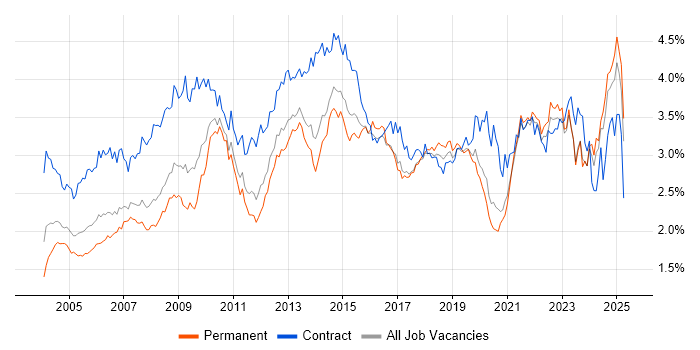
Job vacancy trend for Microsoft Excel in the North of England

Microsoft Excel
Salary Trend in the North of England

3-month moving average salary quoted in jobs citing Microsoft Excel in the North of England.

Salary trend for Microsoft Excel in the North of England

Microsoft Excel
Salary Histogram in the North of England

Salary distribution for jobs citing Microsoft Excel in the North of England over the 6 months to 26 July 2024.

Salary histogram for Microsoft Excel in the North of England

Microsoft Excel
Job Locations in the North of England

The table below looks at the demand and provides a guide to the median salaries quoted in IT jobs citing Microsoft Excel within the North of England region over the 6 months to 26 July 2024. The 'Rank Change' column provides an indication of the change in demand within each location based on the same 6 month period last year.

Location Rank Change
on Same Period
Last Year
Matching
Permanent
IT Job Ads
Median Salary
Past 6 Months
Median Salary
% Change
on Same Period
Last Year
Live
Jobs
North West +44 359 £34,750 +7.62% 105
Yorkshire +43 132 £32,500 -1.52% 63
North East -11 43 £27,000 -12.90% 29
Microsoft Excel
England

Microsoft Excel
Co-occurring Skills and Capabilities in the North of England by Category

The follow tables expand on the table above by listing co-occurrences grouped by category. The same employment type, locality and period is covered with up to 20 co-occurrences shown in each of the following categories:

Application Platforms
1 61 (11.42%) SharePoint
2 15 (2.81%) SAS
3 2 (0.37%) CMS
3 2 (0.37%) WordPress
4 1 (0.19%) Confluence
4 1 (0.19%) IIS
4 1 (0.19%) Jupyter
4 1 (0.19%) Microsoft Exchange
Applications
1 224 (41.95%) Microsoft Office
2 157 (29.40%) Microsoft PowerPoint
3 15 (2.81%) Microsoft Project
4 12 (2.25%) Spreadsheet
5 8 (1.50%) MS Visio
6 6 (1.12%) AutoCAD
6 6 (1.12%) SPSS
7 2 (0.37%) Adobe Illustrator
7 2 (0.37%) InDesign
7 2 (0.37%) Photoshop
7 2 (0.37%) Stata
8 1 (0.19%) Acrobat
8 1 (0.19%) Adobe Creative Suite
Business Applications
1 32 (5.99%) iTrent
2 9 (1.69%) NEC Housing
3 5 (0.94%) Shopify
4 4 (0.75%) Magento
4 4 (0.75%) SAP BPC
4 4 (0.75%) SAP FI
4 4 (0.75%) SAP S/4HANA
5 3 (0.56%) Teamcenter
6 2 (0.37%) Epicor Tropos
6 2 (0.37%) SAP ERP
6 2 (0.37%) Visualfiles
7 1 (0.19%) Dynamics CRM
7 1 (0.19%) Dynamics NAV
7 1 (0.19%) Exchequer
7 1 (0.19%) NetSuite
7 1 (0.19%) Oracle Payables
7 1 (0.19%) Oracle Procure-to-Pay
7 1 (0.19%) Primavera
7 1 (0.19%) SAP Business One
Cloud Services
1 117 (21.91%) Power Platform
2 34 (6.37%) Microsoft 365
3 29 (5.43%) SuccessFactors
4 18 (3.37%) Azure
5 12 (2.25%) Google Ads
6 10 (1.87%) Azure Data Factory
6 10 (1.87%) Mimecast
7 8 (1.50%) Facebook Ads
7 8 (1.50%) PowerApps
7 8 (1.50%) SaaS
8 7 (1.31%) Azure DevOps
9 6 (1.12%) Google Analytics
9 6 (1.12%) Power Automate
10 5 (0.94%) OneDrive
11 4 (0.75%) Dynamics 365
11 4 (0.75%) Google Data Studio
11 4 (0.75%) Google Tag Manager
12 2 (0.37%) Adobe Creative Cloud
12 2 (0.37%) AWS
12 2 (0.37%) Google Sheets
Communications & Networking
1 15 (2.81%) DNS
1 15 (2.81%) Internet
2 14 (2.62%) LAN
3 12 (2.25%) Broadband
3 12 (2.25%) WAN
4 5 (0.94%) Firewall
5 3 (0.56%) TCP/IP
6 2 (0.37%) PBX
6 2 (0.37%) Skype
6 2 (0.37%) VLAN
6 2 (0.37%) WPA
7 1 (0.19%) DHCP
7 1 (0.19%) Intranet
7 1 (0.19%) Wi-Fi
7 1 (0.19%) Wireless
Database & Business Intelligence
1 113 (21.16%) Power BI
2 17 (3.18%) Data Warehouse
2 17 (3.18%) SQL Server Reporting Services
3 16 (3.00%) SQL Server
4 13 (2.43%) Tableau
5 10 (1.87%) Azure SQL Data Warehouse
5 10 (1.87%) Power Query
6 6 (1.12%) QlikView
7 5 (0.94%) BusinessObjects
7 5 (0.94%) PowerPivot
8 4 (0.75%) Amazon QuickSight
8 4 (0.75%) MS Access
8 4 (0.75%) Relational Database
8 4 (0.75%) SAP BW
9 3 (0.56%) Data Mining
9 3 (0.56%) SQL Server Integration Services
10 2 (0.37%) Big Data
10 2 (0.37%) Crystal Reports
10 2 (0.37%) Electronic Patient Records
10 2 (0.37%) Qlik Sense
Development Applications
1 32 (5.99%) JIRA
2 8 (1.50%) SQL Server Management Studio (SSMS)
3 2 (0.37%) Eclipse
3 2 (0.37%) Katalon Studio
3 2 (0.37%) Postman
3 2 (0.37%) Team Foundation Server
4 1 (0.19%) Visual Studio
General
1 309 (57.87%) Social Skills
2 241 (45.13%) Finance
3 160 (29.96%) Analytical Skills
4 141 (26.40%) Retail
5 113 (21.16%) Legal
6 47 (8.80%) Banking
7 35 (6.55%) Marketing
8 24 (4.49%) Public Sector
9 21 (3.93%) Organisational Skills
10 20 (3.75%) Billing
10 20 (3.75%) Presentation Skills
11 17 (3.18%) Law
12 16 (3.00%) Telecoms
13 13 (2.43%) Aerospace
13 13 (2.43%) Inclusion and Diversity
14 11 (2.06%) Games
14 11 (2.06%) General Ledger
14 11 (2.06%) Local Government
15 10 (1.87%) Advertising
15 10 (1.87%) Documentation Skills
Job Titles
1 174 (32.58%) Analyst
2 55 (10.30%) Development Manager
3 54 (10.11%) Business Manager
4 52 (9.74%) Business Development Manager
5 38 (7.12%) Developer
6 34 (6.37%) Senior
7 33 (6.18%) HR Analyst
8 31 (5.81%) Financial Analyst
9 26 (4.87%) Graduate
10 25 (4.68%) Data Analyst
11 23 (4.31%) Administrator
12 20 (3.75%) Business Intelligence Developer
13 19 (3.56%) IT Support
14 17 (3.18%) Quantity Surveyor
15 16 (3.00%) Senior Analyst
15 16 (3.00%) Service Analyst
16 15 (2.81%) Junior
17 13 (2.43%) Project Manager
18 12 (2.25%) 1st Line Support
18 12 (2.25%) Service Desk Analyst
Libraries, Frameworks & Software Standards
1 15 (2.81%) XML
2 11 (2.06%) HTML
3 9 (1.69%) .NET
4 6 (1.12%) .NET Framework
4 6 (1.12%) BREW
5 5 (0.94%) CSS
5 5 (0.94%) JSON
6 4 (0.75%) Oracle Fusion
7 3 (0.56%) REST
7 3 (0.56%) SOAP
8 2 (0.37%) EDI
8 2 (0.37%) Gherkin
8 2 (0.37%) GTK
8 2 (0.37%) jQuery
8 2 (0.37%) Middleware
8 2 (0.37%) STL
8 2 (0.37%) Web Services
8 2 (0.37%) XSLT
9 1 (0.19%) .NET Core
9 1 (0.19%) Blazor
Miscellaneous
1 40 (7.49%) Self-Motivation
2 33 (6.18%) Management Information System
3 28 (5.24%) Onboarding
4 11 (2.06%) Social Media
5 10 (1.87%) Analytical Mindset
5 10 (1.87%) Data Centre
6 8 (1.50%) Data Structures
7 6 (1.12%) NHS
8 5 (0.94%) Digital Media
8 5 (0.94%) EPoS
9 4 (0.75%) Driving Licence
10 3 (0.56%) Mobile App
11 2 (0.37%) e-Learning
11 2 (0.37%) Enterprise Software
11 2 (0.37%) Foreign Exchange (FX)
11 2 (0.37%) Handset
11 2 (0.37%) Renewable Energy
11 2 (0.37%) Robotics
12 1 (0.19%) Graphic Design
12 1 (0.19%) PMI
Operating Systems
1 49 (9.18%) Windows
2 17 (3.18%) Windows Vista
3 16 (3.00%) Windows 10
4 7 (1.31%) Windows Server
5 6 (1.12%) Mac OS
6 2 (0.37%) Android
6 2 (0.37%) Apple iOS
6 2 (0.37%) Linux
6 2 (0.37%) Windows 7
6 2 (0.37%) Windows 8
Processes & Methodologies
1 126 (23.60%) Business Intelligence
2 103 (19.29%) Decision-Making
3 99 (18.54%) Logistics
4 97 (18.16%) Problem-Solving
5 82 (15.36%) Continuous Improvement
6 73 (13.67%) Data Analysis
7 68 (12.73%) Business Development
8 63 (11.80%) Budgeting and Forecasting
9 60 (11.24%) Data Management
10 59 (11.05%) Process Improvement
11 58 (10.86%) Customer Service
12 54 (10.11%) Analytics
13 51 (9.55%) Strategic Planning
14 50 (9.36%) Contract Negotiation
15 49 (9.18%) Coaching
16 41 (7.68%) Validation
17 38 (7.12%) Project Management
17 38 (7.12%) Risk Management
17 38 (7.12%) Time Management
18 36 (6.74%) Agile
Programming Languages
1 89 (16.67%) SQL
2 46 (8.61%) VBA
3 26 (4.87%) Python
4 15 (2.81%) Data Analysis Expressions
4 15 (2.81%) JavaScript
5 12 (2.25%) C#
6 9 (1.69%) MATLAB
6 9 (1.69%) T-SQL
7 6 (1.12%) R
7 6 (1.12%) VB.NET
8 2 (0.37%) C++
8 2 (0.37%) Groovy
9 1 (0.19%) Clipper
9 1 (0.19%) VB
Qualifications
1 134 (25.09%) Degree
2 50 (9.36%) CIMA
3 46 (8.61%) ACCA
4 14 (2.62%) Security Cleared
5 11 (2.06%) DBS Check
6 9 (1.69%) Computer Science Degree
6 9 (1.69%) HNC
6 9 (1.69%) HND
7 8 (1.50%) AAT
7 8 (1.50%) ITIL Certification
8 5 (0.94%) CFA
8 5 (0.94%) SC Cleared
9 3 (0.56%) CIPD
10 2 (0.37%) Chartered Engineer
10 2 (0.37%) Master's Degree
10 2 (0.37%) Numerate Degree
10 2 (0.37%) PMI Certification
11 1 (0.19%) APMP
11 1 (0.19%) BPSS Clearance
11 1 (0.19%) PRINCE2 Practitioner
Quality Assurance & Compliance
1 52 (9.74%) GDPR
2 42 (7.87%) Data Quality
3 12 (2.25%) PMO
4 10 (1.87%) Accessibility
4 10 (1.87%) SLA
5 8 (1.50%) ISO/IEC 27001
6 7 (1.31%) QA
7 4 (0.75%) Cyber Essentials
8 3 (0.56%) Sarbanes-Oxley
9 2 (0.37%) COSHH
9 2 (0.37%) ISO 14001
9 2 (0.37%) ISO 9001
9 2 (0.37%) NEBOSH
10 1 (0.19%) Disclosure Scotland
10 1 (0.19%) P3O
System Software
1 25 (4.68%) Active Directory
2 8 (1.50%) VMware Infrastructure
3 4 (0.75%) VMware Server
4 3 (0.56%) Hyper-V
5 2 (0.37%) Virtual Machines
5 2 (0.37%) XenApp
6 1 (0.19%) VMware ESXi
6 1 (0.19%) vSphere
6 1 (0.19%) XenDesktop
Systems Management
1 1 (0.19%) Microsoft Intune
Vendors
1 311 (58.24%) Microsoft
2 55 (10.30%) SAP
3 30 (5.62%) Virgin Media
4 27 (5.06%) NEC
5 22 (4.12%) Google
6 11 (2.06%) Facebook
7 10 (1.87%) Cisco
7 10 (1.87%) Dell
7 10 (1.87%) HP
7 10 (1.87%) NetApp
7 10 (1.87%) ServiceNow
8 9 (1.69%) VMware
9 6 (1.12%) Civica
9 6 (1.12%) Oracle
10 4 (0.75%) Salesforce
11 3 (0.56%) ANSYS
11 3 (0.56%) HubSpot
11 3 (0.56%) iManage
11 3 (0.56%) Instagram
11 3 (0.56%) TikTok