Lead Jobs in the North of England

Leader
England > North of England

The median Leader salary in the North of England is £57,836 per year, according to job vacancies posted during the 6 months leading to 12 July 2025.

The table below provides salary benchmarking and summary statistics, comparing them to the same period in the previous two years.

6 months to
12 Jul 2025
Same period 2024 Same period 2023
Rank 38 13 43
Rank change year-on-year -25 +30 -9
Permanent jobs requiring a Lead 785 1,830 940
As % of all permanent jobs advertised in the North of England 5.95% 9.73% 6.62%
As % of the Job Titles category 6.88% 10.22% 7.44%
Number of salaries quoted 551 1,488 718
10th Percentile £39,000 £40,000 £42,500
25th Percentile £54,793 £55,000 £53,000
Median annual salary (50th Percentile) £57,836 £70,000 £70,000
Median % change year-on-year -17.38% - +16.67%
75th Percentile £78,750 £84,919 £80,000
90th Percentile £97,500 £85,000 £92,500
England median annual salary £72,500 £70,000 £72,500
% change year-on-year +3.57% -3.45% -3.33%

All Permanent IT Job Vacancies
North of England

For comparison with the information above, the following table provides summary statistics for all permanent IT job vacancies in the North of England. Most job vacancies include a discernible job title that can be normalized. As such, the figures in the second row provide an indication of the number of permanent jobs in our overall sample.

Permanent vacancies in the North of England with a recognized job title 11,410 17,904 12,632
% of permanent jobs with a recognized job title 86.48% 95.17% 88.95%
Number of salaries quoted 6,086 13,145 7,841
10th Percentile £25,087 £27,250 £30,500
25th Percentile £32,500 £36,250 £39,375
Median annual salary (50th Percentile) £50,000 £50,000 £54,421
Median % change year-on-year - -8.12% +8.84%
75th Percentile £62,500 £65,000 £69,650
90th Percentile £77,500 £78,750 £81,250
England median annual salary £55,000 £53,000 £60,000
% change year-on-year +3.77% -11.67% -

Lead
Job Vacancy Trend in the North of England

Job postings that featured Lead in the job title as a proportion of all IT jobs advertised in the North of England.
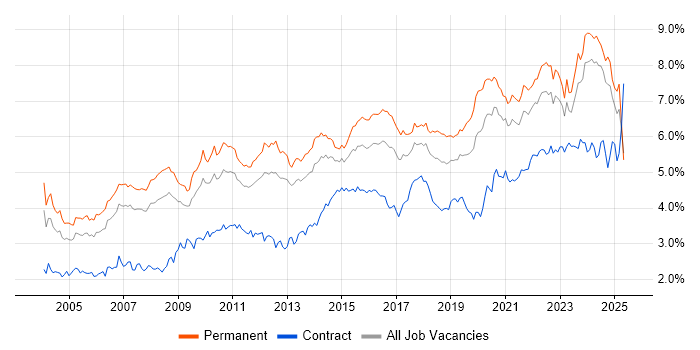
Job vacancy trend for Lead in the North of England

Lead
Salary Trend in the North of England

3-month moving average salary quoted in jobs citing Lead in the North of England.

Salary trend for Lead in the North of England

Lead
Salary Histogram in the North of England

Salary distribution for jobs citing Lead in the North of England over the 6 months to 12 July 2025.

Salary histogram for Lead in the North of England

Lead
Job Locations in the North of England

The table below looks at the demand and provides a guide to the median salaries quoted in IT jobs citing Lead within the North of England region over the 6 months to 12 July 2025. The 'Rank Change' column provides an indication of the change in demand within each location based on the same 6 month period last year.

Location Rank Change
on Same Period
Last Year
Matching
Permanent
IT Job Ads
Median Salary
Past 6 Months
Median Salary
% Change
on Same Period
Last Year
Live
Jobs
North West -24 530 £57,836 -17.38% 238
Yorkshire -25 216 £67,500 -0.74% 188
North East -25 39 £48,000 -31.43% 56
Lead
England

Lead Skill Set
Top 30 Co-occurring Skills and Capabilities in the North of England

For the 6 months to 12 July 2025, Lead job roles required the following skills and capabilities in order of popularity. The figures indicate the absolute number co-occurrences and as a proportion of all permanent job ads across the North of England region featuring Lead in the job title.

1 272 (34.65%) BPSS Clearance
2 261 (33.25%) Agile
3 209 (26.62%) Coaching
4 195 (24.84%) Systems Engineering
5 174 (22.17%) Social Skills
6 169 (21.53%) Degree
7 168 (21.40%) Mentoring
8 123 (15.67%) AWS
9 122 (15.54%) Software Engineering
10 117 (14.90%) Continuous Improvement
11 116 (14.78%) Aerospace
12 105 (13.38%) Finance
13 104 (13.25%) Roadmaps
14 103 (13.12%) Microsoft
15 102 (12.99%) Azure
16 101 (12.87%) Problem-Solving
17 98 (12.48%) Technical Leadership
18 95 (12.10%) DevOps
19 91 (11.59%) Performance Management
20 85 (10.83%) SysML
20 85 (10.83%) Business Strategy
21 83 (10.57%) CI/CD
21 83 (10.57%) Java
22 77 (9.81%) Mathematics
23 76 (9.68%) Physics
23 76 (9.68%) Analytical Skills
23 76 (9.68%) Project Management
23 76 (9.68%) Manufacturing
23 76 (9.68%) Aeronautics
23 76 (9.68%) Cost Control

Lead Skill Set
Co-occurring Skills and Capabilities in the North of England by Category

The follow tables expand on the table above by listing co-occurrences grouped by category. The same employment type, locality and period is covered with up to 20 co-occurrences shown in each of the following categories:

Application Platforms
1 58 (7.39%) Confluence
2 10 (1.27%) SharePoint
3 6 (0.76%) Microsoft Exchange
4 5 (0.64%) SAS
5 2 (0.25%) ArcGIS
6 1 (0.13%) Apache Airflow
6 1 (0.13%) IIS
Applications
1 60 (7.64%) Microsoft Office
2 50 (6.37%) Simulink
3 10 (1.27%) Microsoft Excel
4 4 (0.51%) Microsoft PowerPoint
5 3 (0.38%) Adobe Creative Suite
6 2 (0.25%) Adobe Illustrator
Business Applications
1 8 (1.02%) Dynamics CRM
2 6 (0.76%) Infor LN
2 6 (0.76%) SAP BPC
3 2 (0.25%) SAP S/4HANA
4 1 (0.13%) Payment Gateway
4 1 (0.13%) Salesforce CRM
4 1 (0.13%) SAP EHS
4 1 (0.13%) SAP IBP
4 1 (0.13%) SAP PP
Cloud Services
1 123 (15.67%) AWS
2 102 (12.99%) Azure
3 35 (4.46%) GCP
4 28 (3.57%) SaaS
5 22 (2.80%) Microsoft 365
6 21 (2.68%) Serverless
7 15 (1.91%) AWS Lambda
8 14 (1.78%) Power Platform
9 12 (1.53%) Azure DevOps
9 12 (1.53%) GitHub
10 9 (1.15%) Amazon SQS
10 9 (1.15%) Dynamics 365
11 8 (1.02%) Amazon EKS
12 7 (0.89%) Cloud Composer
12 7 (0.89%) Entra ID
12 7 (0.89%) GitHub Actions
13 6 (0.76%) Amazon ECS
13 6 (0.76%) AWS CloudFormation
14 5 (0.64%) AWS Fargate
14 5 (0.64%) Pulumi
Communications & Networking
1 14 (1.78%) Firewall
2 10 (1.27%) VPN
3 9 (1.15%) Broadband
3 9 (1.15%) Internet
3 9 (1.15%) LAN
3 9 (1.15%) Network Security
3 9 (1.15%) WAN
4 5 (0.64%) DKIM
4 5 (0.64%) DMARC
4 5 (0.64%) DNSSEC
4 5 (0.64%) SMTP
5 4 (0.51%) VLAN
6 3 (0.38%) BGP
6 3 (0.38%) OSPF
6 3 (0.38%) TCP/IP
7 2 (0.25%) DHCP
7 2 (0.25%) DNS
7 2 (0.25%) Modbus
7 2 (0.25%) VoIP
8 1 (0.13%) Cisco ISE
Database & Business Intelligence
1 33 (4.20%) NoSQL
2 25 (3.18%) MongoDB
3 18 (2.29%) SQL Server
4 16 (2.04%) PostgreSQL
5 13 (1.66%) Power BI
5 13 (1.66%) Tableau
6 9 (1.15%) BigQuery
7 8 (1.02%) Relational Database
8 6 (0.76%) MySQL
9 5 (0.64%) Amazon RDS
10 4 (0.51%) Data Warehouse
10 4 (0.51%) RDBMS
11 3 (0.38%) Data Lake
11 3 (0.38%) Metadata
12 2 (0.25%) Amazon Aurora
12 2 (0.25%) Azure SQL Database
12 2 (0.25%) DynamoDB
12 2 (0.25%) Looker
13 1 (0.13%) Big Data
13 1 (0.13%) Redis
Development Applications
1 74 (9.43%) JIRA
2 20 (2.55%) Jenkins
3 16 (2.04%) Git
4 14 (1.78%) GitLab
5 10 (1.27%) Oracle Forms
6 7 (0.89%) Selenium
7 5 (0.64%) JMeter
8 4 (0.51%) Jaeger
8 4 (0.51%) TeamCity
9 3 (0.38%) CircleCI
10 2 (0.25%) Atlassian Bamboo
10 2 (0.25%) ESLint
10 2 (0.25%) Gatling
10 2 (0.25%) Karma Test Runner
10 2 (0.25%) NeoLoad
10 2 (0.25%) Postman
10 2 (0.25%) REST Assured
10 2 (0.25%) Storybook
10 2 (0.25%) WebDriver
10 2 (0.25%) webpack
General
1 174 (22.17%) Social Skills
2 116 (14.78%) Aerospace
3 105 (13.38%) Finance
4 76 (9.68%) Aeronautics
4 76 (9.68%) Analytical Skills
4 76 (9.68%) Manufacturing
5 49 (6.24%) Banking
6 26 (3.31%) Organisational Skills
7 23 (2.93%) Public Sector
8 18 (2.29%) Inclusion and Diversity
9 17 (2.17%) Marketing
10 12 (1.53%) Retail
11 10 (1.27%) Electronics
11 10 (1.27%) Law
12 9 (1.15%) Legal
12 9 (1.15%) Police
13 8 (1.02%) Influencing Skills
14 5 (0.64%) Local Government
15 4 (0.51%) Advertising
15 4 (0.51%) Games
Libraries, Frameworks & Software Standards
1 58 (7.39%) .NET
2 37 (4.71%) React
3 29 (3.69%) Node.js
4 25 (3.18%) Kafka
5 20 (2.55%) .NET Core
6 18 (2.29%) AngularJS
7 15 (1.91%) CSS
8 13 (1.66%) HTML
9 10 (1.27%) Vue
10 9 (1.15%) ASP.NET
11 8 (1.02%) Blazor
11 8 (1.02%) Laravel
11 8 (1.02%) Playwright
11 8 (1.02%) RabbitMQ
11 8 (1.02%) React Native
11 8 (1.02%) RESTful
11 8 (1.02%) Spring
12 7 (0.89%) Spring Boot
13 6 (0.76%) Elastic Stack
13 6 (0.76%) Next.js
Miscellaneous
1 48 (6.11%) Product Ownership
2 31 (3.95%) Management Information System
3 25 (3.18%) Cloud Native
4 24 (3.06%) Distributed Systems
5 15 (1.91%) Social Media
6 13 (1.66%) Onboarding
7 12 (1.53%) Hybrid Cloud
7 12 (1.53%) Private Cloud
8 9 (1.15%) Data Centre
8 9 (1.15%) Public Cloud
8 9 (1.15%) Renewable Energy
9 8 (1.02%) Legacy Systems
9 8 (1.02%) Mobile App
9 8 (1.02%) NHS
9 8 (1.02%) Self-Motivation
10 6 (0.76%) Algorithms
10 6 (0.76%) Clustering
10 6 (0.76%) Data Protection Act
11 5 (0.64%) Analytical Mindset
11 5 (0.64%) Greenfield Project
Operating Systems
1 40 (5.10%) Windows
2 16 (2.04%) Linux
3 14 (1.78%) Windows Vista
4 8 (1.02%) Windows Server
5 5 (0.64%) Android
6 4 (0.51%) Unix
7 2 (0.25%) Apple iOS
8 1 (0.13%) CentOS
8 1 (0.13%) Debian
8 1 (0.13%) Red Hat Enterprise Linux
8 1 (0.13%) Ubuntu
8 1 (0.13%) Windows 10
Processes & Methodologies
1 261 (33.25%) Agile
2 209 (26.62%) Coaching
3 195 (24.84%) Systems Engineering
4 168 (21.40%) Mentoring
5 122 (15.54%) Software Engineering
6 117 (14.90%) Continuous Improvement
7 104 (13.25%) Roadmaps
8 101 (12.87%) Problem-Solving
9 98 (12.48%) Technical Leadership
10 95 (12.10%) DevOps
11 91 (11.59%) Performance Management
12 85 (10.83%) Business Strategy
12 85 (10.83%) SysML
13 83 (10.57%) CI/CD
14 77 (9.81%) Mathematics
15 76 (9.68%) Cost Control
15 76 (9.68%) Physics
15 76 (9.68%) Project Management
16 69 (8.79%) Microservices
17 68 (8.66%) Line Management
Programming Languages
1 83 (10.57%) Java
2 74 (9.43%) JavaScript
3 68 (8.66%) Python
4 63 (8.03%) SQL
5 58 (7.39%) C#
6 42 (5.35%) TypeScript
7 20 (2.55%) MATLAB
8 16 (2.04%) C
9 15 (1.91%) Bash
10 13 (1.66%) Go
11 11 (1.40%) PHP
12 6 (0.76%) Bicep
12 6 (0.76%) PowerShell
13 5 (0.64%) R
13 5 (0.64%) Ruby
14 4 (0.51%) Kotlin
14 4 (0.51%) PL/SQL
15 3 (0.38%) Scala
16 1 (0.13%) Data Analysis Expressions
16 1 (0.13%) T-SQL
Qualifications
1 272 (34.65%) BPSS Clearance
2 169 (21.53%) Degree
3 24 (3.06%) HNC
3 24 (3.06%) Six Sigma Black Belt
3 24 (3.06%) Six Sigma Green Belt
4 23 (2.93%) HND
5 21 (2.68%) Computer Science Degree
6 19 (2.42%) Security Cleared
7 17 (2.17%) DBS Check
8 14 (1.78%) SC Cleared
9 10 (1.27%) ACCA
9 10 (1.27%) CIMA
10 9 (1.15%) AWS Certification
11 4 (0.51%) ISTQB
12 3 (0.38%) AWS Certified Cloud Practitioner
12 3 (0.38%) Master's Degree
12 3 (0.38%) Microsoft Certification
13 2 (0.25%) Azure Certification
13 2 (0.25%) MCITP
13 2 (0.25%) MCSE
Quality Assurance & Compliance
1 23 (2.93%) QA
2 15 (1.91%) ISO/IEC 27001
3 14 (1.78%) GDPR
4 12 (1.53%) ISO 9001
5 11 (1.40%) NIST
6 10 (1.27%) Cyber Essentials
6 10 (1.27%) IFRS
7 8 (1.02%) AQAP
8 7 (0.89%) SLA
9 6 (0.76%) Accessibility
9 6 (0.76%) GAAP
10 5 (0.64%) Data Quality
11 4 (0.51%) Basel II
11 4 (0.51%) Basel III
11 4 (0.51%) Dodd-Frank
11 4 (0.51%) IFRS 9
11 4 (0.51%) PCI DSS
12 2 (0.25%) IEC 62304
12 2 (0.25%) ISO 13485
12 2 (0.25%) PMO
System Software
1 54 (6.88%) Docker
2 15 (1.91%) Virtual Machines
3 7 (0.89%) Hyper-V
4 5 (0.64%) VMware Infrastructure
5 3 (0.38%) Active Directory
Systems Management
1 53 (6.75%) Terraform
2 52 (6.62%) Kubernetes
3 26 (3.31%) Ansible
4 12 (1.53%) Grafana
4 12 (1.53%) Prometheus
5 5 (0.64%) Puppet
6 4 (0.51%) Argo
6 4 (0.51%) Kustomize
6 4 (0.51%) Progress Chef
7 2 (0.25%) Functional Safety
8 1 (0.13%) Microsoft Data Protection Manager
8 1 (0.13%) Proxmox
8 1 (0.13%) SCCM
8 1 (0.13%) SCOM
8 1 (0.13%) WSUS
Vendors
1 103 (13.12%) Microsoft
2 74 (9.43%) SAP
3 56 (7.13%) Siemens
4 50 (6.37%) MathWorks
5 21 (2.68%) Oracle
6 20 (2.55%) Google
7 14 (1.78%) Cisco
8 12 (1.53%) ServiceNow
9 10 (1.27%) Cognos
10 8 (1.02%) Concur
10 8 (1.02%) Fortinet
10 8 (1.02%) JD Edwards
10 8 (1.02%) Palo Alto
11 7 (0.89%) Aruba
11 7 (0.89%) Mellanox
11 7 (0.89%) NVIDIA
12 6 (0.76%) Databricks
12 6 (0.76%) Infor
12 6 (0.76%) VMware
13 5 (0.64%) Veritas