Project Management Jobs in the North of England

Project Management
England > North of England

The following table provides summary statistics for permanent job vacancies advertised in the North of England with a requirement for Project Management skills. Included is a benchmarking guide to the salaries offered in vacancies that have cited Project Management over the 6 months to 1 December 2023 with a comparison to the same period in the previous 2 years.

6 months to
1 Dec 2023
Same period 2022 Same period 2021
Rank 33 33 46
Rank change year-on-year 0 +13 +10
Permanent jobs citing Project Management 576 1,359 973
As % of all permanent jobs advertised in the North of England 7.35% 7.99% 5.80%
As % of the Processes & Methodologies category 7.73% 8.30% 6.09%
Number of salaries quoted 406 756 664
10th Percentile £33,750 £32,779 £32,389
25th Percentile £45,080 £41,250 £37,914
Median annual salary (50th Percentile) £55,000 £52,250 £47,500
Median % change year-on-year +5.26% +10.00% +1.06%
75th Percentile £63,750 £65,625 £57,500
90th Percentile £75,500 £72,500 £67,500
England median annual salary £60,000 £59,500 £55,000
% change year-on-year +0.84% +8.18% -

All Process and Methodology Skills
North of England

Project Management is in the Processes and Methodologies category. The following table is for comparison with the above and provides summary statistics for all permanent job vacancies advertised in the North of England with a requirement for process or methodology skills.

Permanent vacancies with a requirement for process or methodology skills 7,454 16,367 15,973
As % of all permanent jobs advertised in the North of England 95.13% 96.19% 95.21%
Number of salaries quoted 5,215 9,420 11,689
10th Percentile £30,000 £30,783 £30,000
25th Percentile £41,250 £40,000 £37,500
Median annual salary (50th Percentile) £55,000 £52,500 £50,000
Median % change year-on-year +4.76% +5.00% +5.26%
75th Percentile £68,750 £70,000 £65,000
90th Percentile £83,750 £84,775 £78,750
England median annual salary £60,000 £62,500 £60,000
% change year-on-year -4.00% +4.17% +9.09%

Project Management
Job Vacancy Trend in the North of England

Job postings citing Project Management as a proportion of all IT jobs advertised in the North of England.
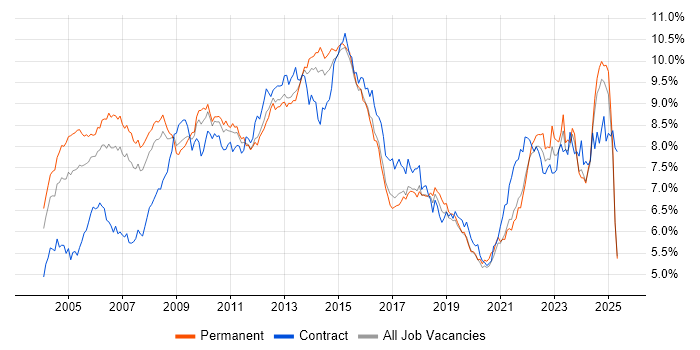
Job vacancy trend for Project Management in the North of England

Project Management
Salary Trend in the North of England

3-month moving average salary quoted in jobs citing Project Management in the North of England.

Salary trend for Project Management in the North of England

Project Management
Salary Histogram in the North of England

Salary distribution for jobs citing Project Management in the North of England over the 6 months to 1 December 2023.

Salary histogram for Project Management in the North of England

Project Management
Job Locations in the North of England

The table below looks at the demand and provides a guide to the median salaries quoted in IT jobs citing Project Management within the North of England region over the 6 months to 1 December 2023. The 'Rank Change' column provides an indication of the change in demand within each location based on the same 6 month period last year.

Location Rank Change
on Same Period
Last Year
Matching
Permanent
IT Job Ads
Median Salary
Past 6 Months
Median Salary
% Change
on Same Period
Last Year
Live
Jobs
North West -7 283 £56,000 +3.70% 274
Yorkshire -1 252 £55,000 +4.76% 182
North East +2 41 £52,500 +7.14% 69
Project Management
England

Project Management
Co-occurring Skills and Capabilities in the North of England by Category

The follow tables expand on the table above by listing co-occurrences grouped by category. The same employment type, locality and period is covered with up to 20 co-occurrences shown in each of the following categories:

Application Platforms
1 13 (2.26%) Confluence
2 11 (1.91%) SharePoint
3 7 (1.22%) SAS
4 4 (0.69%) CMS
4 4 (0.69%) IIS
5 2 (0.35%) Drupal
5 2 (0.35%) Mendix
5 2 (0.35%) MS Exchange
6 1 (0.17%) Apache Spark
6 1 (0.17%) Exchange Server 2010
6 1 (0.17%) Moodle
6 1 (0.17%) WordPress
Applications
1 30 (5.21%) Microsoft Office
2 19 (3.30%) Microsoft Project
3 14 (2.43%) Microsoft Excel
4 8 (1.39%) Microsoft PowerPoint
4 8 (1.39%) Trello
5 5 (0.87%) AutoCAD
5 5 (0.87%) MS Visio
6 3 (0.52%) Spreadsheet
Business Applications
1 7 (1.22%) SAP S/4HANA
2 6 (1.04%) SAP CO
2 6 (1.04%) SAP FI
2 6 (1.04%) SAP FI/CO
3 3 (0.52%) Unit4 Business World
4 2 (0.35%) Dynamics NAV
4 2 (0.35%) Oracle ERP
4 2 (0.35%) Primavera
4 2 (0.35%) SAP ERP
5 1 (0.17%) Oracle EBS
5 1 (0.17%) Oracle EBS R12
5 1 (0.17%) Oracle Financials
5 1 (0.17%) SAP Business One
5 1 (0.17%) SAP CRM
5 1 (0.17%) SAP EWM
5 1 (0.17%) SAP MM
5 1 (0.17%) SAP SCM
5 1 (0.17%) SAP SD
5 1 (0.17%) SAP WM
5 1 (0.17%) Workday HCM
Cloud Services
1 88 (15.28%) Azure
2 48 (8.33%) AWS
3 37 (6.42%) Microsoft 365
3 37 (6.42%) SaaS
4 25 (4.34%) IaaS
5 23 (3.99%) PaaS
6 17 (2.95%) Power Platform
7 10 (1.74%) Azure DevOps
8 9 (1.56%) GCP
9 6 (1.04%) Entra ID
9 6 (1.04%) PowerApps
9 6 (1.04%) Serverless
10 4 (0.69%) Dynamics 365
10 4 (0.69%) GitHub
10 4 (0.69%) Power Automate
11 3 (0.52%) Amazon CloudWatch
11 3 (0.52%) Amazon EC2
11 3 (0.52%) AWS CloudFormation
11 3 (0.52%) AWS Lambda
11 3 (0.52%) IBM Cloud
Communications & Networking
1 19 (3.30%) SAN
2 17 (2.95%) WAN
3 15 (2.60%) LAN
4 14 (2.43%) Firewall
5 9 (1.56%) VPN
5 9 (1.56%) WLAN
6 8 (1.39%) VoIP
7 7 (1.22%) DNS
8 6 (1.04%) Structured Cabling
8 6 (1.04%) TCP/IP
8 6 (1.04%) Wi-Fi
9 5 (0.87%) DHCP
9 5 (0.87%) Wireless
10 4 (0.69%) Internet
10 4 (0.69%) SD-WAN
10 4 (0.69%) Unified Communications
11 3 (0.52%) HTTP
11 3 (0.52%) Network Security
11 3 (0.52%) VLAN
12 2 (0.35%) FTP
Database & Business Intelligence
1 16 (2.78%) SQL Server
2 11 (1.91%) Power BI
3 7 (1.22%) Base SAS
3 7 (1.22%) Metadata
3 7 (1.22%) PostgreSQL
4 5 (0.87%) Relational Database
5 3 (0.52%) Amazon RDS
5 3 (0.52%) Big Data
5 3 (0.52%) MySQL
6 2 (0.35%) Data Hub
6 2 (0.35%) Electronic Patient Records
6 2 (0.35%) Oracle Reports
6 2 (0.35%) RDBMS
6 2 (0.35%) Tableau
7 1 (0.17%) BusinessObjects Business Intelligence
7 1 (0.17%) Data Warehouse
7 1 (0.17%) DB2
Development Applications
1 47 (8.16%) JIRA
2 15 (2.60%) Git
3 3 (0.52%) Jenkins
4 2 (0.35%) Subversion
5 1 (0.17%) Cucumber
5 1 (0.17%) GitLab
5 1 (0.17%) Maven
5 1 (0.17%) Postman
5 1 (0.17%) REST Assured
5 1 (0.17%) Selenium
5 1 (0.17%) SoapUI
5 1 (0.17%) Team Foundation Server
5 1 (0.17%) TestNG
General
1 200 (34.72%) Social Skills
2 124 (21.53%) Finance
3 66 (11.46%) Analytical Skills
4 53 (9.20%) Public Sector
5 50 (8.68%) Presentation Skills
6 43 (7.47%) Organisational Skills
7 39 (6.77%) Inclusion and Diversity
8 33 (5.73%) Retail
9 31 (5.38%) Manufacturing
10 22 (3.82%) Legal
11 18 (3.13%) Law
12 16 (2.78%) Marketing
13 11 (1.91%) Banking
14 10 (1.74%) Aerospace
14 10 (1.74%) Influencing Skills
14 10 (1.74%) Local Government
15 9 (1.56%) Pharmaceutical
16 7 (1.22%) Telecoms
17 5 (0.87%) Electronics
18 4 (0.69%) Tech for Good
Job Titles
1 227 (39.41%) Project Manager
2 81 (14.06%) Senior
3 75 (13.02%) IT Manager
4 59 (10.24%) Senior Manager
5 57 (9.90%) Analyst
6 54 (9.38%) IT Project Manager
7 52 (9.03%) Senior Project Manager
8 39 (6.77%) Architect
9 33 (5.73%) Business Analyst
10 32 (5.56%) Lead
11 23 (3.99%) Consultant
12 21 (3.65%) Infrastructure Architect
13 19 (3.30%) Infrastructure Manager
14 18 (3.13%) Software Project Manager
15 17 (2.95%) Developer
16 15 (2.60%) Software Manager
17 14 (2.43%) Technical Manager
18 13 (2.26%) Delivery Manager
18 13 (2.26%) Infrastructure Project Manager
19 12 (2.08%) Programmer
Libraries, Frameworks & Software Standards
1 20 (3.47%) React
2 17 (2.95%) .NET
3 16 (2.78%) SOAP
4 12 (2.08%) XML
5 10 (1.74%) RESTful
6 7 (1.22%) React Native
6 7 (1.22%) REST
7 6 (1.04%) HTML
7 6 (1.04%) JSON
8 5 (0.87%) CSS
9 4 (0.69%) Laravel
9 4 (0.69%) Node.js
9 4 (0.69%) Vue
10 3 (0.52%) .NET Framework
10 3 (0.52%) Django
10 3 (0.52%) Twitter Bootstrap
10 3 (0.52%) Velocity
11 1 (0.17%) OAuth
11 1 (0.17%) OpenID
11 1 (0.17%) XACML
Miscellaneous
1 60 (10.42%) Virtual Team
2 56 (9.72%) Management Information System
3 38 (6.60%) Product Ownership
4 25 (4.34%) Public Cloud
5 20 (3.47%) Onboarding
6 15 (2.60%) Private Cloud
6 15 (2.60%) Self-Motivation
7 14 (2.43%) Data Centre
8 9 (1.56%) Analytical Mindset
9 8 (1.39%) Data Protection Act
10 7 (1.22%) e-Learning
10 7 (1.22%) Life Science
10 7 (1.22%) NHS
11 5 (0.87%) Video Conferencing
12 4 (0.69%) CCTV
12 4 (0.69%) Digital Signage
12 4 (0.69%) PMI
13 3 (0.52%) Cloud Native
13 3 (0.52%) Driving Licence
13 3 (0.52%) Hybrid Cloud
Operating Systems
1 52 (9.03%) Windows
2 27 (4.69%) Linux
3 18 (3.13%) Windows Server
4 7 (1.22%) Unix
4 7 (1.22%) Windows 10
5 5 (0.87%) Windows Server 2008
6 4 (0.69%) Windows Server 2019
7 3 (0.52%) Windows Server 2012
8 1 (0.17%) Apple iOS
8 1 (0.17%) VMS
8 1 (0.17%) Windows 8
8 1 (0.17%) Windows XP
Processes & Methodologies
1 208 (36.11%) Agile
2 177 (30.73%) Project Delivery
3 116 (20.14%) Problem-Solving
4 110 (19.10%) PRINCE2
5 92 (15.97%) Stakeholder Management
6 89 (15.45%) Computer Science
7 84 (14.58%) Scrum
8 78 (13.54%) SDLC
9 76 (13.19%) Actionable Insight
10 68 (11.81%) ERP
11 61 (10.59%) Mentoring
12 60 (10.42%) Waterfall
13 58 (10.07%) ITIL
13 58 (10.07%) Migration
14 47 (8.16%) Change Management
15 46 (7.99%) Agile Project Management
16 44 (7.64%) Line Management
16 44 (7.64%) Service Management
17 41 (7.12%) Decision-Making
18 40 (6.94%) Roadmaps
Programming Languages
1 35 (6.08%) SQL
2 34 (5.90%) JavaScript
3 24 (4.17%) Python
4 17 (2.95%) Java
5 12 (2.08%) C#
6 11 (1.91%) PHP
7 7 (1.22%) PowerShell
7 7 (1.22%) SAS Macro
8 5 (0.87%) C++
9 4 (0.69%) C
9 4 (0.69%) T-SQL
10 2 (0.35%) VBA
11 1 (0.17%) Bash
11 1 (0.17%) Delphi
11 1 (0.17%) Kusto Query Language
Qualifications
1 142 (24.65%) Degree
2 65 (11.28%) Computer Science Degree
3 43 (7.47%) Security Cleared
4 29 (5.03%) SC Cleared
5 24 (4.17%) PMI Certification
6 20 (3.47%) PMP
7 10 (1.74%) Master's Degree
8 7 (1.22%) Numerate Degree
9 6 (1.04%) Azure Certification
9 6 (1.04%) MBA
9 6 (1.04%) PRINCE2 Certification
9 6 (1.04%) PRINCE2 Practitioner
10 5 (0.87%) Chartered Engineer
11 4 (0.69%) CCNP
11 4 (0.69%) Cisco Certification
12 3 (0.52%) HND
12 3 (0.52%) ITIL Certification
12 3 (0.52%) Microsoft Certification
13 2 (0.35%) ISEB
13 2 (0.35%) PhD
Quality Assurance & Compliance
1 50 (8.68%) PMO
2 29 (5.03%) QA
3 10 (1.74%) SLA
4 7 (1.22%) CDISC
5 5 (0.87%) COBIT
5 5 (0.87%) Data Quality
5 5 (0.87%) GRC
5 5 (0.87%) ISO/IEC 27001
6 4 (0.69%) GDPR
7 3 (0.52%) Accessibility
7 3 (0.52%) Cyber Essentials
8 2 (0.35%) ISO 9001
8 2 (0.35%) Sarbanes-Oxley
9 1 (0.17%) Cyber Essentials PLUS
9 1 (0.17%) GAAP
9 1 (0.17%) GMP
9 1 (0.17%) NIST
9 1 (0.17%) WCAG
System Software
1 23 (3.99%) Active Directory
2 12 (2.08%) VMware Infrastructure
3 6 (1.04%) Docker
4 5 (0.87%) Embedded Firmware
4 5 (0.87%) Firmware
4 5 (0.87%) Hyper-V
4 5 (0.87%) vSphere
5 2 (0.35%) VMware ESXi
6 1 (0.17%) Citrix Hypervisor
6 1 (0.17%) RACF
6 1 (0.17%) Virtual Machines
Systems Management
1 23 (3.99%) Terraform
2 18 (3.13%) Ansible
3 10 (1.74%) Microsoft Intune
4 6 (1.04%) Kubernetes
5 4 (0.69%) SCCM
6 3 (0.52%) Grafana
6 3 (0.52%) Nessus
6 3 (0.52%) Single Sign-On
7 1 (0.17%) Cisco Prime
7 1 (0.17%) Progress Chef
7 1 (0.17%) Puppet
Vendors
1 81 (14.06%) Microsoft
2 44 (7.64%) Salesforce
3 41 (7.12%) NEC
4 24 (4.17%) Oracle
5 23 (3.99%) SAP
6 19 (3.30%) Cisco
6 19 (3.30%) ServiceNow
7 17 (2.95%) VMware
8 13 (2.26%) Google
9 9 (1.56%) Citrix
10 8 (1.39%) IBM
11 6 (1.04%) Remedy
12 4 (0.69%) Dell
12 4 (0.69%) Dynatrace
12 4 (0.69%) Sophos
13 3 (0.52%) arcserve
13 3 (0.52%) Juniper
13 3 (0.52%) Meraki
13 3 (0.52%) NetApp
13 3 (0.52%) Splunk