CSS Jobs in the North of England

CSS (Cascading Style Sheets)
England > North of England

The table below provides summary statistics for permanent job vacancies advertised in the North of England requiring CSS skills. It includes a benchmarking guide to the annual salaries offered in vacancies that cited CSS over the 6 months leading up to 26 July 2024, comparing them to the same period in the previous two years.

6 months to
26 Jul 2024
Same period 2023 Same period 2022
Rank 47 78 30
Rank change year-on-year +31 -48 -1
Permanent jobs citing CSS 654 527 1,566
As % of all permanent jobs advertised in the North of England 4.01% 4.06% 8.17%
As % of the Libraries, Frameworks & Software Standards category 21.81% 15.61% 26.01%
Number of salaries quoted 409 426 792
10th Percentile £30,000 £36,750 £31,250
25th Percentile £37,500 £42,500 £37,500
Median annual salary (50th Percentile) £47,500 £52,500 £50,000
Median % change year-on-year -9.52% +5.00% +11.11%
75th Percentile £65,000 £62,500 £61,250
90th Percentile £72,500 £82,524 £69,000
England median annual salary £52,500 £57,500 £55,000
% change year-on-year -8.70% +4.55% +10.00%

All Software Libraries and Frameworks
North of England

CSS falls under the Software Libraries and Frameworks category. For comparison with the information above, the following table provides summary statistics for all permanent job vacancies requiring technical specification, industry standards, software libraries and framework skills in the North of England.

Permanent vacancies with a requirement for technical specification, industry standards, software libraries and framework skills 2,999 3,377 6,021
As % of all permanent jobs advertised in the North of England 18.40% 26.02% 31.42%
Number of salaries quoted 2,245 2,069 3,903
10th Percentile £34,000 £37,700 £34,500
25th Percentile £42,500 £46,250 £42,500
Median annual salary (50th Percentile) £55,000 £57,500 £55,000
Median % change year-on-year -4.35% +4.55% +10.00%
75th Percentile £70,000 £72,500 £70,000
90th Percentile £79,240 £85,000 £82,500
England median annual salary £60,000 £67,500 £65,000
% change year-on-year -11.11% +3.85% +8.33%

CSS
Job Vacancy Trend in the North of England

Job postings citing CSS as a proportion of all IT jobs advertised in the North of England.
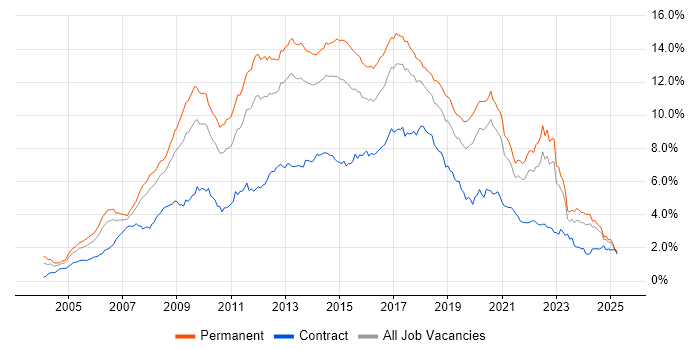
Job vacancy trend for CSS in the North of England

CSS
Salary Trend in the North of England

3-month moving average salary quoted in jobs citing CSS in the North of England.

Salary trend for CSS in the North of England

CSS
Salary Histogram in the North of England

Salary distribution for jobs citing CSS in the North of England over the 6 months to 26 July 2024.

Salary histogram for CSS in the North of England

CSS
Job Locations in the North of England

The table below looks at the demand and provides a guide to the median salaries quoted in IT jobs citing CSS within the North of England region over the 6 months to 26 July 2024. The 'Rank Change' column provides an indication of the change in demand within each location based on the same 6 month period last year.

Location Rank Change
on Same Period
Last Year
Matching
Permanent
IT Job Ads
Median Salary
Past 6 Months
Median Salary
% Change
on Same Period
Last Year
Live
Jobs
North West +44 446 £50,000 -4.76% 58
Yorkshire +12 174 £45,000 -14.29% 31
North East -9 34 £42,750 -20.47% 16
CSS
England

CSS
Co-occurring Skills and Capabilities in the North of England by Category

The follow tables expand on the table above by listing co-occurrences grouped by category. The same employment type, locality and period is covered with up to 20 co-occurrences shown in each of the following categories:

Application Platforms
1 63 (9.63%) ArcGIS
2 56 (8.56%) GeoServer
3 47 (7.19%) WordPress
4 39 (5.96%) CMS
5 12 (1.83%) Umbraco
6 11 (1.68%) IIS
7 10 (1.53%) Apache Solr
8 8 (1.22%) Drupal
9 6 (0.92%) Apache
9 6 (0.92%) nginx
9 6 (0.92%) SAS
10 4 (0.61%) SharePoint
11 2 (0.31%) Confluence
11 2 (0.31%) WildFly
12 1 (0.15%) BizTalk Server
12 1 (0.15%) IBM Notes
12 1 (0.15%) Joomla!
12 1 (0.15%) Microsoft Exchange
12 1 (0.15%) Moodle
12 1 (0.15%) Totara
Applications
1 9 (1.38%) Photoshop
2 6 (0.92%) MadCap Flare
2 6 (0.92%) RoboHelp
3 5 (0.76%) Microsoft Excel
3 5 (0.76%) Sketch
4 4 (0.61%) Adobe Creative Suite
4 4 (0.61%) Adobe XD
5 3 (0.46%) Adobe Illustrator
5 3 (0.46%) SPSS
6 1 (0.15%) Acrobat
6 1 (0.15%) Microsoft Office
Business Applications
1 27 (4.13%) Magento
2 11 (1.68%) Shopify
3 8 (1.22%) Payment Gateway
4 4 (0.61%) Dynamics CRM
5 1 (0.15%) NetSuite
5 1 (0.15%) SAP Business One
5 1 (0.15%) Visualfiles
Cloud Services
1 302 (46.18%) Azure
2 127 (19.42%) AWS
3 92 (14.07%) Azure DevOps
4 77 (11.77%) IBM Cloud
5 53 (8.10%) Serverless
6 49 (7.49%) Azure Functions
6 49 (7.49%) Azure Service Bus
7 41 (6.27%) Azure API Management
7 41 (6.27%) Azure Logic Apps
8 34 (5.20%) GitHub
9 28 (4.28%) Power Platform
10 20 (3.06%) GCP
11 18 (2.75%) SaaS
12 14 (2.14%) npm
13 13 (1.99%) Figma
14 12 (1.83%) Dynamics 365
14 12 (1.83%) Power Automate
14 12 (1.83%) PowerApps
15 9 (1.38%) Cloud Computing
15 9 (1.38%) Google Analytics
Communications & Networking
1 12 (1.83%) DNS
1 12 (1.83%) HTTP
2 8 (1.22%) MQTT
3 7 (1.07%) Intranet
3 7 (1.07%) SSL
4 5 (0.76%) Firewall
4 5 (0.76%) TCP/IP
5 4 (0.61%) Broadband
6 3 (0.46%) VPN
7 2 (0.31%) Internet
8 1 (0.15%) FTP
8 1 (0.15%) Remote Desktop
8 1 (0.15%) SSH
8 1 (0.15%) WAN
Database & Business Intelligence
1 161 (24.62%) PostgreSQL
2 102 (15.60%) SQL Server
3 90 (13.76%) MongoDB
3 90 (13.76%) MySQL
4 85 (13.00%) NoSQL
5 77 (11.77%) DB2
6 63 (9.63%) GIS
6 63 (9.63%) Relational Database
7 56 (8.56%) QGIS
8 18 (2.75%) Azure SQL Database
8 18 (2.75%) Power BI
9 10 (1.53%) Tableau
10 8 (1.22%) Redis
11 7 (1.07%) Geospatial Data
12 6 (0.92%) Data Warehouse
12 6 (0.92%) DynamoDB
13 5 (0.76%) Amazon RDS
13 5 (0.76%) Power Query
14 4 (0.61%) SQL Server Reporting Services
15 2 (0.31%) SQL Server Integration Services
Development Applications
1 117 (17.89%) Git
2 21 (3.21%) Visual Studio
3 18 (2.75%) JIRA
4 14 (2.14%) PHPUnit
5 13 (1.99%) GitLab
6 11 (1.68%) Cypress.io
6 11 (1.68%) JUnit
7 10 (1.53%) Jenkins
8 8 (1.22%) webpack
9 7 (1.07%) Bitbucket
10 6 (0.92%) gulp
10 6 (0.92%) Team Foundation Server
11 4 (0.61%) Jasmine
11 4 (0.61%) TeamCity
12 3 (0.46%) NUnit
12 3 (0.46%) SonarQube
13 2 (0.31%) Karma Test Runner
13 2 (0.31%) Postman
13 2 (0.31%) Visual Studio Code
13 2 (0.31%) Yeoman
General
1 131 (20.03%) Social Skills
2 80 (12.23%) Public Sector
3 43 (6.57%) Inclusion and Diversity
4 42 (6.42%) Finance
5 37 (5.66%) Analytical Skills
6 33 (5.05%) Marketing
7 31 (4.74%) Retail
8 27 (4.13%) Legal
9 20 (3.06%) Advertising
10 16 (2.45%) Games
11 11 (1.68%) Automotive
12 10 (1.53%) Multimedia
12 10 (1.53%) Organisational Skills
13 9 (1.38%) Banking
14 8 (1.22%) Influencing Skills
15 6 (0.92%) Law
15 6 (0.92%) Publishing
16 5 (0.76%) Manufacturing
17 4 (0.61%) Documentation Skills
17 4 (0.61%) Health Technology
Job Titles
1 386 (59.02%) Developer
2 120 (18.35%) Software Engineer
3 115 (17.58%) Senior
4 77 (11.77%) Full Stack Developer
5 59 (9.02%) .NET Developer
5 59 (9.02%) PHP Developer
6 56 (8.56%) Senior Developer
7 48 (7.34%) Senior Software Engineer
8 47 (7.19%) Lead
9 43 (6.57%) Azure Developer
9 43 (6.57%) Full Stack Engineer
10 42 (6.42%) Web Developer
11 38 (5.81%) Front-End Developer (Client-Side Developer)
12 36 (5.50%) Azure Engineer
13 29 (4.43%) Software Developer
14 22 (3.36%) Magento Developer
15 18 (2.75%) Lead Developer
15 18 (2.75%) React Developer
16 17 (2.60%) Team Leader
17 14 (2.14%) Senior PHP Developer
Libraries, Frameworks & Software Standards
1 552 (84.40%) HTML
2 339 (51.83%) .NET
3 318 (48.62%) React
4 193 (29.51%) AngularJS
5 175 (26.76%) Vue
6 166 (25.38%) ASP.NET
7 159 (24.31%) jQuery
8 133 (20.34%) Twitter Bootstrap
9 118 (18.04%) .NET Core
10 114 (17.43%) Node.js
11 104 (15.90%) REST
11 104 (15.90%) Web Services
12 99 (15.14%) HTML5
13 83 (12.69%) ASP.NET Core
14 77 (11.77%) Backbone.js
14 77 (11.77%) Ember.js
15 66 (10.09%) .NET Framework
16 65 (9.94%) RESTful
17 64 (9.79%) PostGIS
18 60 (9.17%) OpenLayers
Miscellaneous
1 78 (11.93%) Algorithms
1 78 (11.93%) Data Structures
2 77 (11.77%) Blockchain
2 77 (11.77%) Hybrid Cloud
3 37 (5.66%) e-Learning
4 25 (3.82%) Mobile App
5 23 (3.52%) Greenfield Project
6 14 (2.14%) NHS
7 12 (1.83%) Self-Motivation
8 10 (1.53%) Social Media
9 9 (1.38%) Product Ownership
10 8 (1.22%) IoT
11 7 (1.07%) Graphic Design
11 7 (1.07%) Legacy Systems
12 6 (0.92%) Cloud Native
12 6 (0.92%) CMDB
13 5 (0.76%) Onboarding
14 4 (0.61%) Data Protection Act
14 4 (0.61%) Public Cloud
15 3 (0.46%) Animation
Operating Systems
1 120 (18.35%) Linux
2 98 (14.98%) Windows
3 89 (13.61%) Android
4 88 (13.46%) Apple iOS
5 4 (0.61%) Unix
6 2 (0.31%) Red Hat Enterprise Linux
7 1 (0.15%) Kali Linux
7 1 (0.15%) Ubuntu
7 1 (0.15%) VMS
Processes & Methodologies
1 276 (42.20%) Web Development
2 244 (37.31%) Agile
3 220 (33.64%) Full Stack Development
4 199 (30.43%) DevOps
5 191 (29.20%) User Experience
6 174 (26.61%) Software Engineering
7 154 (23.55%) MVC
8 136 (20.80%) Problem-Solving
9 123 (18.81%) OO
10 114 (17.43%) OOP
11 112 (17.13%) Design Patterns
12 94 (14.37%) Artificial Intelligence
12 94 (14.37%) SOLID
13 88 (13.46%) Responsive Web Design
14 84 (12.84%) Mentoring
15 83 (12.69%) MVVM
16 82 (12.54%) Front End Development
17 78 (11.93%) Design Thinking
18 77 (11.77%) Co-Creation
19 72 (11.01%) Actionable Insight
Programming Languages
1 545 (83.33%) JavaScript
2 335 (51.22%) C#
3 207 (31.65%) SQL
4 140 (21.41%) Python
5 110 (16.82%) TypeScript
6 109 (16.67%) PHP
7 76 (11.62%) Java
8 29 (4.43%) T-SQL
9 13 (1.99%) VB.NET
10 8 (1.22%) Go
11 6 (0.92%) Ruby
12 5 (0.76%) Data Analysis Expressions
13 4 (0.61%) PowerShell
13 4 (0.61%) VBA
13 4 (0.61%) XAML
14 3 (0.46%) Ada
14 3 (0.46%) R
15 2 (0.31%) C++
15 2 (0.31%) Dart
15 2 (0.31%) JSX
Qualifications
1 66 (10.09%) Degree
2 57 (8.72%) SC Cleared
2 57 (8.72%) Security Cleared
3 29 (4.43%) Computer Science Degree
4 6 (0.92%) HND
5 3 (0.46%) Microsoft Certification
6 2 (0.31%) Azure Certification
6 2 (0.31%) DBS Check
6 2 (0.31%) Numerate Degree
7 1 (0.15%) CEH
7 1 (0.15%) CHECK Team Leader
7 1 (0.15%) CHECK Team Member
7 1 (0.15%) CIPD
7 1 (0.15%) CISSP
7 1 (0.15%) DV Cleared
7 1 (0.15%) OSCP
Quality Assurance & Compliance
1 25 (3.82%) Accessibility
2 10 (1.53%) QA
3 7 (1.07%) GDPR
4 6 (0.92%) WCAG
5 4 (0.61%) ISO/IEC 27001
6 1 (0.15%) NIST
System Software
1 23 (3.52%) Docker
2 7 (1.07%) Firmware
3 3 (0.46%) Active Directory
4 1 (0.15%) Hyper-V
4 1 (0.15%) Virtual Machines
4 1 (0.15%) VMware Infrastructure
Systems Management
1 20 (3.06%) Kubernetes
2 4 (0.61%) Single Sign-On
3 2 (0.31%) Ansible
3 2 (0.31%) Terraform
4 1 (0.15%) Nmap
4 1 (0.15%) Plesk
Vendors
1 77 (11.77%) IBM
1 77 (11.77%) Red Hat
2 63 (9.63%) ESRI
2 63 (9.63%) Microsoft
3 33 (5.05%) Adobe
4 27 (4.13%) Google
5 12 (1.83%) Oracle
6 11 (1.68%) Atlassian
6 11 (1.68%) ServiceNow
7 10 (1.53%) Facebook
8 6 (0.92%) HP
9 4 (0.61%) MuleSoft
9 4 (0.61%) WooCommerce
10 3 (0.46%) Ahrefs
10 3 (0.46%) F5
10 3 (0.46%) Northgate
10 3 (0.46%) PayPal
10 3 (0.46%) SAP
10 3 (0.46%) WorldPay
11 2 (0.31%) Autodesk