Risk Management Jobs in Scotland

Risk Management
UK > Scotland

The table below provides summary statistics for permanent job vacancies advertised in Scotland requiring Risk Management skills. It includes a benchmarking guide to the annual salaries offered in vacancies that cited Risk Management over the 6 months leading up to 26 July 2024, comparing them to the same period in the previous two years.

6 months to
26 Jul 2024
Same period 2023 Same period 2022
Rank 27 94 130
Rank change year-on-year +67 +36 +15
Permanent jobs citing Risk Management 593 127 130
As % of all permanent jobs advertised in Scotland 10.41% 3.35% 2.13%
As % of the Processes & Methodologies category 11.85% 3.49% 2.31%
Number of salaries quoted 49 57 80
10th Percentile £49,563 £40,468 £38,775
25th Percentile £53,772 £52,500 £50,000
Median annual salary (50th Percentile) £58,500 £70,000 £65,000
Median % change year-on-year -16.43% +7.69% -
75th Percentile £70,000 £87,419 £80,950
90th Percentile £85,000 £101,564 £100,000
UK median annual salary £62,250 £67,500 £65,000
% change year-on-year -7.78% +3.85% -

All Process and Methodology Skills
Scotland

Risk Management falls under the Processes and Methodologies category. For comparison with the information above, the following table provides summary statistics for all permanent job vacancies requiring process or methodology skills in Scotland.

Permanent vacancies with a requirement for process or methodology skills 5,004 3,640 5,626
As % of all permanent jobs advertised in Scotland 87.82% 95.94% 92.38%
Number of salaries quoted 2,133 1,969 3,041
10th Percentile £31,250 £31,555 £31,250
25th Percentile £41,250 £41,250 £41,250
Median annual salary (50th Percentile) £54,000 £55,000 £55,000
Median % change year-on-year -1.82% - +15.79%
75th Percentile £67,500 £71,250 £70,000
90th Percentile £80,000 £82,548 £83,750
UK median annual salary £55,000 £60,000 £60,000
% change year-on-year -8.33% - +9.09%

Risk Management
Job Vacancy Trend in Scotland

Job postings citing Risk Management as a proportion of all IT jobs advertised in Scotland.
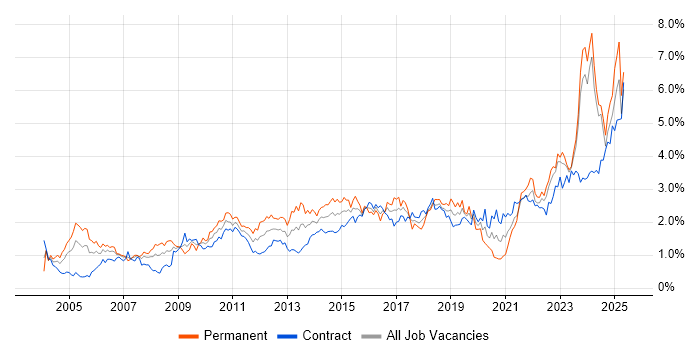
Job vacancy trend for Risk Management in Scotland

Risk Management
Salary Trend in Scotland

3-month moving average salary quoted in jobs citing Risk Management in Scotland.

Salary trend for Risk Management in Scotland

Risk Management
Salary Histogram in Scotland

Salary distribution for jobs citing Risk Management in Scotland over the 6 months to 26 July 2024.

Salary histogram for Risk Management in Scotland

Risk Management
Job Locations in Scotland

The table below looks at the demand and provides a guide to the median salaries quoted in IT jobs citing Risk Management within the Scotland region over the 6 months to 26 July 2024. The 'Rank Change' column provides an indication of the change in demand within each location based on the same 6 month period last year.

Location Rank Change
on Same Period
Last Year
Matching
Permanent
IT Job Ads
Median Salary
Past 6 Months
Median Salary
% Change
on Same Period
Last Year
Live
Jobs
Glasgow +58 548 £58,250 -15.27% 5
Edinburgh -11 26 £70,000 - 7
Dundee -2 4 £55,380 +15.09%
Argyll and Bute - 4 £60,000 - 2
Aberdeen -6 3 £65,000 +18.18% 3
Fife - 2 - -
South Lanarkshire - 2 - -
East Lothian - 1 - -
Risk Management
UK

Risk Management
Co-occurring Skills and Capabilities in Scotland by Category

The follow tables expand on the table above by listing co-occurrences grouped by category. The same employment type, locality and period is covered with up to 20 co-occurrences shown in each of the following categories:

Application Platforms
1 165 (27.82%) Apache Spark
2 55 (9.27%) Apache
3 47 (7.93%) FileNet
4 15 (2.53%) Apache Airflow
5 6 (1.01%) SharePoint
6 5 (0.84%) SAS
6 5 (0.84%) Tomcat
6 5 (0.84%) WebSphere
Applications
1 13 (2.19%) Microsoft Office
2 7 (1.18%) Microsoft Excel
3 2 (0.34%) Microsoft Project
3 2 (0.34%) Windchill
4 1 (0.17%) AutoCAD
4 1 (0.17%) MS Visio
Business Applications
1 12 (2.02%) Primavera
2 6 (1.01%) Endur
Cloud Services
1 253 (42.66%) AWS
2 48 (8.09%) Amazon S3
3 37 (6.24%) Azure
4 35 (5.90%) GCP
5 30 (5.06%) AWS Lambda
5 30 (5.06%) Serverless
6 29 (4.89%) Amazon EC2
6 29 (4.89%) Amazon ECS
6 29 (4.89%) Amazon EKS
6 29 (4.89%) Amazon EMR
6 29 (4.89%) Amazon SQS
7 27 (4.55%) BlazeMeter
7 27 (4.55%) Cloud Computing
7 27 (4.55%) GitHub
8 17 (2.87%) Power Platform
9 6 (1.01%) Microsoft 365
10 2 (0.34%) SaaS
11 1 (0.17%) Amazon SageMaker
11 1 (0.17%) AWS Step Functions
11 1 (0.17%) Snowflake
Communications & Networking
1 3 (0.51%) Firewall
1 3 (0.51%) Intrusion Detection
2 2 (0.34%) Network Security
Database & Business Intelligence
1 238 (40.13%) NoSQL
2 138 (23.27%) Big Data
3 120 (20.24%) Hadoop
4 74 (12.48%) Apache Hive
5 60 (10.12%) HBase
6 47 (7.93%) Apache Cassandra
6 47 (7.93%) Elasticsearch
7 36 (6.07%) Data Lake
8 35 (5.90%) Qlik Sense
9 29 (4.89%) Electronic Patient Records
10 19 (3.20%) Relational Database
11 17 (2.87%) Power BI
12 14 (2.36%) Impala
13 11 (1.85%) Tableau
14 5 (0.84%) Pentaho
15 1 (0.17%) Data Warehouse
15 1 (0.17%) PostgreSQL
15 1 (0.17%) SQL Server
Development Applications
1 97 (16.36%) Jenkins
2 66 (11.13%) JUnit
3 63 (10.62%) Git
4 60 (10.12%) Bitbucket Server
5 27 (4.55%) JMeter
6 26 (4.38%) Jasmine
6 26 (4.38%) Mockito
7 22 (3.71%) JIRA
8 9 (1.52%) Cucumber
8 9 (1.52%) Cypress.io
8 9 (1.52%) Gradle
8 9 (1.52%) Maven
9 5 (0.84%) Bitbucket
10 1 (0.17%) webpack
General
1 517 (87.18%) Finance
2 497 (83.81%) Inclusion and Diversity
3 496 (83.64%) Law
4 477 (80.44%) Legal
5 79 (13.32%) Social Skills
6 34 (5.73%) Marketing
7 32 (5.40%) Analytical Skills
8 15 (2.53%) Banking
9 6 (1.01%) Back Office
10 5 (0.84%) Retail
11 4 (0.67%) Aerospace
11 4 (0.67%) Public Sector
11 4 (0.67%) Publishing
12 3 (0.51%) Agriculture
12 3 (0.51%) Influencing Skills
12 3 (0.51%) Investment Banking
12 3 (0.51%) Manufacturing
12 3 (0.51%) Presentation Skills
13 2 (0.34%) Local Government
14 1 (0.17%) Military
Job Titles
1 482 (81.28%) Software Engineer
2 190 (32.04%) Java Engineer
2 190 (32.04%) Java Software Engineer
3 142 (23.95%) AWS Engineer
3 142 (23.95%) AWS Software Engineer
4 135 (22.77%) Big Data Engineer
4 135 (22.77%) Big Data Software Engineer
4 135 (22.77%) Full Stack Engineer
4 135 (22.77%) Full Stack Software Engineer
5 115 (19.39%) Data Engineer
6 81 (13.66%) Python Engineer
6 81 (13.66%) Python Software Engineer
7 55 (9.27%) Scala Engineer
7 55 (9.27%) Scala Software Engineer
8 31 (5.23%) Developer
9 30 (5.06%) AWS Database Engineer
9 30 (5.06%) AWS Developer
9 30 (5.06%) Database Developer
9 30 (5.06%) Database Engineer
9 30 (5.06%) Developer/Software Engineer
Libraries, Frameworks & Software Standards
1 128 (21.59%) Spring
2 117 (19.73%) React
3 98 (16.53%) J2EE
4 97 (16.36%) Kafka
5 89 (15.01%) AngularJS
6 70 (11.80%) JMS
7 66 (11.13%) Hibernate
8 64 (10.79%) HTML
9 63 (10.62%) Node.js
9 63 (10.62%) Twitter Bootstrap
10 50 (8.43%) PySpark
11 47 (7.93%) GraphQL
11 47 (7.93%) Spring Integration
12 42 (7.08%) JSON
13 41 (6.91%) CSS
14 40 (6.75%) jQuery
15 32 (5.40%) XML
16 30 (5.06%) JavaBeans
16 30 (5.06%) Spring Boot
16 30 (5.06%) Web Services
Miscellaneous
1 348 (58.68%) Algorithms
2 118 (19.90%) Onboarding
3 83 (14.00%) Cloud Native
4 27 (4.55%) Market Risk
5 21 (3.54%) Legacy Code
6 19 (3.20%) Data Structures
7 18 (3.04%) Public Cloud
8 9 (1.52%) Operational Technology
9 8 (1.35%) Cyber Threat
9 8 (1.35%) Reference Data
10 7 (1.18%) Management Information System
11 5 (0.84%) Credit Risk
12 4 (0.67%) Legacy Systems
12 4 (0.67%) Product Ownership
13 3 (0.51%) Credit Derivative
13 3 (0.51%) Derivative
13 3 (0.51%) Distributed Denial-of-Service
13 3 (0.51%) Fixed Income
13 3 (0.51%) FMCG
13 3 (0.51%) Hedge funds
Operating Systems
1 85 (14.33%) Unix
2 32 (5.40%) Linux
3 3 (0.51%) Windows
4 1 (0.17%) Windows 10
Processes & Methodologies
1 496 (83.64%) Agile
2 488 (82.29%) Software Engineering
3 477 (80.44%) CI/CD
4 456 (76.90%) SDLC
5 382 (64.42%) Operational Stability
6 367 (61.89%) Machine Learning
7 362 (61.05%) Artificial Intelligence
8 361 (60.88%) Continuous Improvement
9 358 (60.37%) Visualisation
10 320 (53.96%) Community of Practice
11 140 (23.61%) Full Stack Development
12 136 (22.93%) Decision-Making
13 121 (20.40%) Microservices
14 115 (19.39%) Client Onboarding
15 92 (15.51%) KYC
16 90 (15.18%) TDD
17 89 (15.01%) Test Automation
18 80 (13.49%) Problem-Solving
19 65 (10.96%) OO
20 62 (10.46%) Open Source
Programming Languages
1 364 (61.38%) Java
2 329 (55.48%) SQL
3 234 (39.46%) Python
4 85 (14.33%) PL/SQL
5 69 (11.64%) Scala
6 50 (8.43%) JavaScript
7 40 (6.75%) TypeScript
8 5 (0.84%) Shell Script
9 1 (0.17%) C
9 1 (0.17%) C#
Qualifications
1 35 (5.90%) Degree
2 31 (5.23%) Security Cleared
3 17 (2.87%) SC Cleared
4 15 (2.53%) Master's Degree
5 10 (1.69%) Computer Science Degree
6 9 (1.52%) CISM
6 9 (1.52%) CISSP
7 8 (1.35%) PRINCE2 Practitioner
8 3 (0.51%) CISA
8 3 (0.51%) CRISC
9 2 (0.34%) APMP
9 2 (0.34%) BC Cleared
9 2 (0.34%) CompTIA Security+
9 2 (0.34%) HND
9 2 (0.34%) PMP
10 1 (0.17%) Azure Certification
10 1 (0.17%) CESG Certified Professional
10 1 (0.17%) DV Cleared
10 1 (0.17%) Numerate Degree
10 1 (0.17%) RIBA
Quality Assurance & Compliance
1 20 (3.37%) NIST
2 16 (2.70%) ISO/IEC 27001
3 14 (2.36%) SLA
4 10 (1.69%) NCSC
5 9 (1.52%) QA
6 7 (1.18%) Data Quality
7 6 (1.01%) GDPR
8 5 (0.84%) GRC
8 5 (0.84%) ISO/IEC 27002 (supersedes ISO/IEC 17799)
9 4 (0.67%) IFRS
9 4 (0.67%) IFRS 9
9 4 (0.67%) ITGC
9 4 (0.67%) SOC 2
10 1 (0.17%) COBIT
10 1 (0.17%) Cyber Essentials
10 1 (0.17%) ISO 31000
10 1 (0.17%) ISO/IEC 27005
10 1 (0.17%) PCI DSS
System Software
1 60 (10.12%) HDFS
2 1 (0.17%) Active Directory
2 1 (0.17%) Hyper-V
Systems Management
1 89 (15.01%) Kubernetes
2 60 (10.12%) Terraform
3 5 (0.84%) Grafana
3 5 (0.84%) ITRS Geneos
4 1 (0.17%) SCCM
Vendors
1 107 (18.04%) Databricks
2 104 (17.54%) Oracle
3 61 (10.29%) Informatica
4 35 (5.90%) Alteryx
5 30 (5.06%) Cloudera
6 13 (2.19%) Microsoft
7 9 (1.52%) TOWER Software
8 6 (1.01%) OpenLink
9 5 (0.84%) AppDynamics
9 5 (0.84%) CA
9 5 (0.84%) Splunk
9 5 (0.84%) Sybase
10 2 (0.34%) Google
10 2 (0.34%) PTC
11 1 (0.17%) NEC