SC Cleared Jobs

Security Check (SC) Clearance
UK

The table below provides summary statistics for permanent job vacancies with a requirement for SC Cleared qualifications. It includes a benchmarking guide to the salaries offered over the 6 months leading up to 12 May 2025, comparing them to the same period in the previous two years.

6 months to
12 May 2025
Same period 2024 Same period 2023
Rank 104 47 60
Rank change year-on-year -57 +13 +53
Permanent jobs citing SC Cleared 1,617 4,648 5,057
As % of all permanent jobs advertised in the UK 2.93% 4.68% 5.01%
As % of the Qualifications category 5.95% 16.91% 15.30%
Number of salaries quoted 1,208 2,628 2,595
10th Percentile £41,250 £32,500 £35,000
25th Percentile £47,500 £45,000 £46,214
Median annual salary (50th Percentile) £60,000 £57,500 £61,700
Median % change year-on-year +4.35% -6.81% +7.43%
75th Percentile £75,000 £70,250 £77,500
90th Percentile £87,500 £83,750 £87,500
UK excluding London median annual salary £57,500 £55,000 £55,000
% change year-on-year +4.55% - +3.55%

All Academic and Professional Certifications
UK

SC Cleared falls under the Academic Qualifications and Professional Certifications category. For comparison with the information above, the following table provides summary statistics for all permanent job vacancies requiring academic qualifications or professional certifications.

Permanent vacancies requiring academic qualifications or professional certifications 27,186 27,486 33,056
As % of all permanent jobs advertised in the UK 49.31% 27.70% 32.76%
Number of salaries quoted 11,493 17,304 14,953
10th Percentile £32,500 £28,500 £31,250
25th Percentile £44,000 £38,500 £41,750
Median annual salary (50th Percentile) £55,000 £54,000 £59,526
Median % change year-on-year +1.85% -9.28% +8.23%
75th Percentile £68,568 £71,000 £77,500
90th Percentile £83,750 £87,500 £95,000
UK excluding London median annual salary £52,000 £50,000 £51,500
% change year-on-year +4.00% -2.91% +3.00%

SC Cleared
Job Vacancy Trend

Job postings citing SC Cleared as a proportion of all IT jobs advertised.
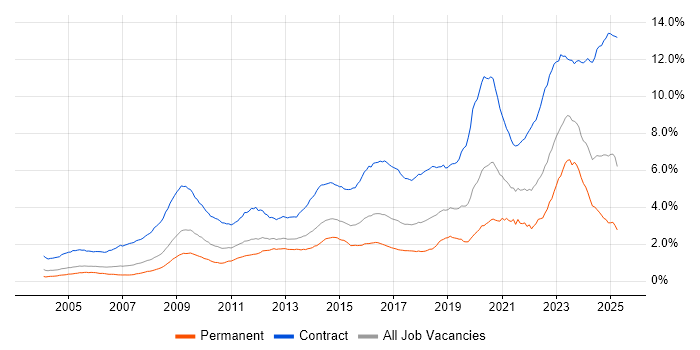
Job vacancy trend for SC Cleared in the UK

SC Cleared
Salary Trend

3-month moving average salary quoted in jobs citing SC Cleared.

Salary trend for SC Cleared in the UK

SC Cleared
Salary Histogram

Salary distribution for jobs citing SC Cleared over the 6 months to 12 May 2025.

Salary histogram for SC Cleared in the UK

SC Cleared
Top 17 Job Locations

The table below looks at the demand and provides a guide to the median salaries quoted in IT jobs citing SC Cleared within the UK over the 6 months to 12 May 2025. The 'Rank Change' column provides an indication of the change in demand within each location based on the same 6 month period last year.

Location Rank Change
on Same Period
Last Year
Matching
Permanent
IT Job Ads
Median Salary
Past 6 Months
Median Salary
% Change
on Same Period
Last Year
Live
Jobs
England -52 1,486 £60,000 +9.09% 1,833
UK excluding London -59 1,161 £57,500 +4.55% 1,537
South East -15 524 £55,000 - 523
Work from Home -79 498 £64,627 +7.71% 1,064
London -11 345 £65,000 -7.14% 519
South West -26 198 £60,000 +14.29% 285
Midlands -35 168 £65,000 +23.81% 200
West Midlands -4 141 £65,000 +18.18% 142
North of England -135 134 £54,500 -5.22% 286
East of England +2 76 £57,500 +4.55% 165
North West -164 75 £55,000 - 161
Yorkshire -14 50 £44,700 -25.50% 103
Wales -31 37 £52,500 +3.45% 34
Scotland -37 26 £62,500 +4.17% 77
East Midlands -51 24 £52,000 +4.00% 46
Northern Ireland -15 9 £87,500 +45.83% 23
North East +27 8 £69,384 +26.15% 23

SC Cleared
Co-occurring Skills and Capabilities by Category

The follow tables expand on the table above by listing co-occurrences grouped by category. The same employment type, locality and period is covered with up to 20 co-occurrences shown in each of the following categories:

Application Platforms
1 29 (1.79%) Microsoft Exchange
2 27 (1.67%) SharePoint
3 18 (1.11%) Confluence
4 15 (0.93%) Apache Spark
5 13 (0.80%) JBoss
5 13 (0.80%) Red Hat Fuse
6 12 (0.74%) Skype for Business
7 10 (0.62%) Exchange Server 2013
8 8 (0.49%) Apache
8 8 (0.49%) Blackberry Enterprise Server
9 7 (0.43%) Oracle SOA Suite
10 5 (0.31%) Alfresco
10 5 (0.31%) CMS
10 5 (0.31%) Headless CMS
11 4 (0.25%) ArcGIS
11 4 (0.25%) Documentum
11 4 (0.25%) nginx
11 4 (0.25%) Tomcat
12 3 (0.19%) Exchange Server 2010
12 3 (0.19%) WinCC
Applications
1 39 (2.41%) Microsoft Office
2 35 (2.16%) Microsoft Excel
3 23 (1.42%) Microsoft PowerPoint
4 8 (0.49%) Adobe XD
5 6 (0.37%) InVision
5 6 (0.37%) Sketch
6 5 (0.31%) Simulink
7 4 (0.25%) Oracle Smart View
8 3 (0.19%) AutoCAD
8 3 (0.19%) Mozilla Thunderbird
8 3 (0.19%) MS Visio
8 3 (0.19%) Revit
9 2 (0.12%) Microsoft Project
9 2 (0.12%) Spreadsheet
9 2 (0.12%) Windchill
10 1 (0.062%) Chatbot
10 1 (0.062%) GNU Octave
10 1 (0.062%) ProjectWise
10 1 (0.062%) Trello
Business Applications
1 16 (0.99%) Dynamics CRM
1 16 (0.99%) SAP S/4HANA
2 12 (0.74%) Oracle EBS
3 11 (0.68%) Sparx Enterprise Architect
4 9 (0.56%) Oracle ERP
5 4 (0.25%) Oracle Financials
5 4 (0.25%) PeopleSoft HCM
6 3 (0.19%) Maximo
6 3 (0.19%) SAP Oil and Gas
6 3 (0.19%) SAP PM
7 2 (0.12%) Oracle Cash Management
7 2 (0.12%) Oracle Payables
7 2 (0.12%) Oracle Receivables
7 2 (0.12%) SAP CO
7 2 (0.12%) SAP FI
7 2 (0.12%) SAP FI/CO
7 2 (0.12%) SAP HR
7 2 (0.12%) SAP MM
7 2 (0.12%) SAP Payroll
7 2 (0.12%) Workday HCM
Cloud Services
1 289 (17.87%) Azure
2 259 (16.02%) AWS
3 83 (5.13%) GCP
4 79 (4.89%) Power Platform
5 76 (4.70%) Serverless
6 70 (4.33%) Microsoft 365
7 51 (3.15%) Azure DevOps
8 43 (2.66%) Amazon ECS
8 43 (2.66%) Entra ID
8 43 (2.66%) OCI
9 42 (2.60%) Dynamics 365
10 32 (1.98%) Amazon EC2
10 32 (1.98%) AWS CloudFormation
11 31 (1.92%) Amazon EKS
12 30 (1.86%) AWS Lambda
13 28 (1.73%) SaaS
14 26 (1.61%) AWS KMS
14 26 (1.61%) Azure Data Factory
15 23 (1.42%) PowerApps
16 21 (1.30%) PaaS
Communications & Networking
1 202 (12.49%) Firewall
2 129 (7.98%) WAN
3 117 (7.24%) Network Security
4 95 (5.88%) BGP
5 75 (4.64%) LAN
6 73 (4.51%) OSPF
7 62 (3.83%) VPN
8 59 (3.65%) EIGRP
9 51 (3.15%) SD-WAN
10 43 (2.66%) TCP/IP
11 41 (2.54%) Ethernet
12 39 (2.41%) Cisco ISE
13 36 (2.23%) DNS
13 36 (2.23%) MPLS
14 34 (2.10%) Cisco Firepower
14 34 (2.10%) IPsec
15 32 (1.98%) Cisco ASA
16 31 (1.92%) VLAN
17 28 (1.73%) Software-Defined Radio
18 22 (1.36%) SMTP
Database & Business Intelligence
1 83 (5.13%) PostgreSQL
2 46 (2.84%) Relational Database
3 42 (2.60%) Power BI
4 34 (2.10%) SQL Server
5 33 (2.04%) MongoDB
6 27 (1.67%) Amazon RDS
7 21 (1.30%) MySQL
8 19 (1.18%) Elasticsearch
9 18 (1.11%) Data Warehouse
10 15 (0.93%) NoSQL
10 15 (0.93%) Redis
11 13 (0.80%) Big Data
11 13 (0.80%) Data Lake
11 13 (0.80%) RDBMS
12 11 (0.68%) Tableau
13 10 (0.62%) Metadata
14 9 (0.56%) DynamoDB
14 9 (0.56%) GIS
15 7 (0.43%) Oracle ODI
16 6 (0.37%) Amazon Redshift
Development Applications
1 83 (5.13%) Git
2 75 (4.64%) Jenkins
3 40 (2.47%) JIRA
4 37 (2.29%) JUnit
5 29 (1.79%) GitLab
6 27 (1.67%) JMeter
7 21 (1.30%) Mockito
8 13 (0.80%) Selenium
9 9 (0.56%) Subversion
10 8 (0.49%) Maven
10 8 (0.49%) Postman
11 7 (0.43%) Axure RP
11 7 (0.43%) NDoc
11 7 (0.43%) Rational DOORS
11 7 (0.43%) Robot Framework
12 6 (0.37%) Bitbucket Server
12 6 (0.37%) Cypress.io
12 6 (0.37%) Gatling
12 6 (0.37%) Locust
13 5 (0.31%) Storybook
General
1 337 (20.84%) Social Skills
2 225 (13.91%) Public Sector
3 162 (10.02%) Finance
4 107 (6.62%) Analytical Skills
4 107 (6.62%) Inclusion and Diversity
5 50 (3.09%) Aerospace
5 50 (3.09%) Law
6 45 (2.78%) Marketing
6 45 (2.78%) Military
7 39 (2.41%) Influencing Skills
8 35 (2.16%) Telecoms
9 28 (1.73%) Manufacturing
9 28 (1.73%) Presentation Skills
10 27 (1.67%) Electronics
10 27 (1.67%) Retail
11 21 (1.30%) Advertising
12 20 (1.24%) Pharmaceutical
13 17 (1.05%) Legal
14 13 (0.80%) Organisational Skills
15 10 (0.62%) Documentation Skills
Job Titles
1 297 (18.37%) Architect
2 178 (11.01%) Senior
3 169 (10.45%) Developer
4 143 (8.84%) Network Engineer
5 111 (6.86%) Network Architect
6 103 (6.37%) Lead
7 93 (5.75%) Consultant
8 85 (5.26%) Analyst
9 78 (4.82%) Solutions Architect
10 66 (4.08%) Support Engineer
11 58 (3.59%) Designer
12 57 (3.53%) Software Engineer
13 53 (3.28%) Systems Engineer
14 47 (2.91%) Java Developer
14 47 (2.91%) Security Engineer
15 37 (2.29%) Data Engineer
16 36 (2.23%) Cloud Architect
16 36 (2.23%) Senior Developer
17 35 (2.16%) DevOps Engineer
18 32 (1.98%) Network Designer
Libraries, Frameworks & Software Standards
1 70 (4.33%) React
2 58 (3.59%) HTML
2 58 (3.59%) Spring
3 53 (3.28%) REST
4 51 (3.15%) Spring Boot
5 49 (3.03%) Kafka
6 47 (2.91%) Web Services
7 43 (2.66%) RESTful
8 42 (2.60%) AngularJS
9 39 (2.41%) CSS
10 31 (1.92%) JSON
11 29 (1.79%) Apache Camel
11 29 (1.79%) SOAP
12 24 (1.48%) Hibernate
13 23 (1.42%) ActiveMQ
14 22 (1.36%) .NET
15 20 (1.24%) Elastic Stack
15 20 (1.24%) PySpark
16 19 (1.18%) Node.js
17 18 (1.11%) Django
Miscellaneous
1 75 (4.64%) Data Centre
2 70 (4.33%) Management Information System
3 43 (2.66%) Distributed Systems
4 41 (2.54%) Cloud Native
5 35 (2.16%) e-Learning
5 35 (2.16%) Public Cloud
6 30 (1.86%) FPGA
7 28 (1.73%) Algorithms
7 28 (1.73%) SCADA
8 24 (1.48%) Onboarding
8 24 (1.48%) Security Posture
8 24 (1.48%) Self-Motivation
9 23 (1.42%) Product Ownership
10 21 (1.30%) Private Cloud
11 19 (1.18%) Virtual Team
12 18 (1.11%) Cyber Threat
12 18 (1.11%) Driving Licence
12 18 (1.11%) Security Operations Centre
13 17 (1.05%) Embedded Systems
14 15 (0.93%) MicroBlaze
Operating Systems
1 182 (11.26%) Windows
2 163 (10.08%) Linux
3 73 (4.51%) Windows Server
4 30 (1.86%) Unix
5 22 (1.36%) Windows 10
6 20 (1.24%) Red Hat Enterprise Linux
7 16 (0.99%) Android
8 12 (0.74%) Embedded Linux
9 11 (0.68%) Apple iOS
9 11 (0.68%) Windows Server 2019
10 7 (0.43%) Mac OS
10 7 (0.43%) Windows Server 2016
11 5 (0.31%) AIX
11 5 (0.31%) Ubuntu
12 4 (0.25%) Solaris
12 4 (0.25%) VMS
13 3 (0.19%) Amazon Linux
14 2 (0.12%) CentOS
14 2 (0.12%) Oracle Linux
14 2 (0.12%) Windows Server 2012
Processes & Methodologies
1 327 (20.22%) Agile
2 234 (14.47%) DevOps
3 179 (11.07%) CI/CD
4 177 (10.95%) Problem-Solving
5 157 (9.71%) Cybersecurity
6 151 (9.34%) Mentoring
7 141 (8.72%) Software Engineering
8 113 (6.99%) Scrum
9 110 (6.80%) Analytics
10 107 (6.62%) Technical Leadership
11 102 (6.31%) Computer Science
12 96 (5.94%) Continuous Improvement
13 90 (5.57%) Roadmaps
14 89 (5.50%) Microservices
15 85 (5.26%) Customer Service
16 82 (5.07%) Artificial Intelligence
17 79 (4.89%) ITIL
18 75 (4.64%) Business Intelligence
19 74 (4.58%) Containerisation
20 73 (4.51%) Risk Management
Programming Languages
1 206 (12.74%) Python
2 143 (8.84%) Java
3 126 (7.79%) JavaScript
4 125 (7.73%) SQL
5 71 (4.39%) PowerShell
6 53 (3.28%) C++
7 52 (3.22%) C#
8 51 (3.15%) TypeScript
9 38 (2.35%) C
10 29 (1.79%) Bash
11 24 (1.48%) MATLAB
12 22 (1.36%) Shell Script
13 18 (1.11%) Kusto Query Language
14 14 (0.87%) Perl
14 14 (0.87%) Scala
15 10 (0.62%) Go
16 9 (0.56%) Fortran
16 9 (0.56%) R
16 9 (0.56%) Ruby
17 6 (0.37%) Groovy
Qualifications
1 1,617 (100.00%) Security Cleared
2 307 (18.99%) DV Cleared
3 231 (14.29%) Degree
4 101 (6.25%) Cisco Certification
5 75 (4.64%) CCNA
6 63 (3.90%) Computer Science Degree
7 60 (3.71%) CCNP
8 41 (2.54%) AWS Certification
8 41 (2.54%) CISSP
9 36 (2.23%) Microsoft Certification
10 33 (2.04%) BPSS Clearance
11 32 (1.98%) JNCIS
12 30 (1.86%) Master's Degree
13 23 (1.42%) CISM
13 23 (1.42%) ISTQB
14 20 (1.24%) Azure Certification
14 20 (1.24%) TOGAF Certification
15 18 (1.11%) AWS Certified Solutions Architect
15 18 (1.11%) HND
16 15 (0.93%) HNC
Quality Assurance & Compliance
1 59 (3.65%) SLA
2 50 (3.09%) ISO/IEC 27001
3 41 (2.54%) NIST
4 37 (2.29%) QA
5 27 (1.67%) GDPR
6 25 (1.55%) NCSC
7 22 (1.36%) Accessibility
7 22 (1.36%) Def Stans
8 20 (1.24%) Data Quality
9 19 (1.18%) GRC
10 13 (0.80%) Cyber Essentials
10 13 (0.80%) HIPAA
11 11 (0.68%) JSP 440
12 10 (0.62%) WCAG
13 9 (0.56%) Cyber Essentials PLUS
14 8 (0.49%) ISO 9001
14 8 (0.49%) NIST 800
14 8 (0.49%) RMADS
15 4 (0.25%) ISO 14001
15 4 (0.25%) ISO 9000
System Software
1 144 (8.91%) Docker
2 86 (5.32%) Active Directory
3 53 (3.28%) VMware Infrastructure
4 32 (1.98%) Firmware
5 30 (1.86%) VMware NSX
6 28 (1.73%) Embedded Firmware
7 16 (0.99%) Virtual Machines
8 10 (0.62%) Hyper-V
9 9 (0.56%) Virtual Desktop
10 6 (0.37%) VMware ESXi
11 5 (0.31%) vSphere
12 4 (0.25%) BitLocker
12 4 (0.25%) DFS Replication
13 2 (0.12%) ISA Server
14 1 (0.062%) Apache ZooKeeper
14 1 (0.062%) IAG
14 1 (0.062%) Microsoft App-V
14 1 (0.062%) Postfix
14 1 (0.062%) Virtual Servers
14 1 (0.062%) VMware Workstation
Systems Management
1 124 (7.67%) Terraform
2 121 (7.48%) Kubernetes
3 87 (5.38%) Ansible
4 58 (3.59%) FortiGate
5 29 (1.79%) QRadar
6 27 (1.67%) Prometheus
7 22 (1.36%) Grafana
8 16 (0.99%) Kibana
9 15 (0.93%) SCCM
10 11 (0.68%) AWS Copilot
11 9 (0.56%) Microsoft Intune
11 9 (0.56%) Nessus
12 7 (0.43%) Single Sign-On
13 6 (0.37%) ArcSight ESM
14 5 (0.31%) Argo
14 5 (0.31%) Progress Chef
14 5 (0.31%) vCenter Server
15 4 (0.25%) Active Directory Federation Services
15 4 (0.25%) Graylog
15 4 (0.25%) HAProxy
Vendors
1 287 (17.75%) Cisco
2 235 (14.53%) Microsoft
3 175 (10.82%) Juniper
4 110 (6.80%) VMware
5 67 (4.14%) Google
6 66 (4.08%) Oracle
7 65 (4.02%) Fortinet
8 52 (3.22%) SAP
9 49 (3.03%) F5
10 46 (2.84%) Splunk
11 43 (2.66%) ServiceNow
12 38 (2.35%) CheckPoint
13 31 (1.92%) SolarWinds
14 27 (1.67%) Blue Coat
14 27 (1.67%) Red Hat
15 18 (1.11%) Dynatrace
16 16 (0.99%) Databricks
16 16 (0.99%) Forcepoint
17 15 (0.93%) McAfee
17 15 (0.93%) Salesforce