Software Engineering Job Trends in England

Software Engineering
UK > England

The table below provides summary statistics and salary benchmarking for jobs advertised in England requiring Software Engineering skills. It covers vacancies from the 6 months leading up to 18 September 2025, with comparisons to the same periods in the previous two years.

6 months to
18 Sep 2025
Same period 2024 Same period 2023
Rank 24 11 17
Rank change year-on-year -13 +6 -5
Permanent jobs citing Software Engineering 3,220 7,522 4,923
As % of all permanent jobs advertised in England 7.45% 10.90% 9.13%
As % of the Processes & Methodologies category 8.39% 13.35% 9.68%
Number of salaries quoted 1,797 4,834 3,695
10th Percentile £47,500 £40,000 £45,000
25th Percentile £57,500 £50,000 £53,750
Median annual salary (50th Percentile) £77,500 £65,000 £72,500
Median % change year-on-year +19.23% -10.34% +3.57%
75th Percentile £110,000 £93,750 £100,000
90th Percentile £135,000 £122,500 £127,500
UK median annual salary £75,000 £65,000 £70,000
% change year-on-year +15.38% -7.14% -

All Process and Methodology Skills
England

Software Engineering falls under the Processes and Methodologies category. For comparison with the information above, the following table provides summary statistics for all permanent job vacancies requiring process or methodology skills in England.

Permanent vacancies with a requirement for process or methodology skills 38,364 56,336 50,848
As % of all permanent jobs advertised in England 88.77% 81.63% 94.28%
Number of salaries quoted 22,058 32,210 38,175
10th Percentile £28,500 £32,000 £33,500
25th Percentile £37,500 £42,500 £45,000
Median annual salary (50th Percentile) £55,000 £57,500 £62,400
Median % change year-on-year -4.35% -7.85% +4.00%
75th Percentile £76,250 £77,500 £81,250
90th Percentile £97,500 £96,250 £100,000
UK median annual salary £55,000 £57,500 £60,000
% change year-on-year -4.35% -4.17% -

Software Engineering
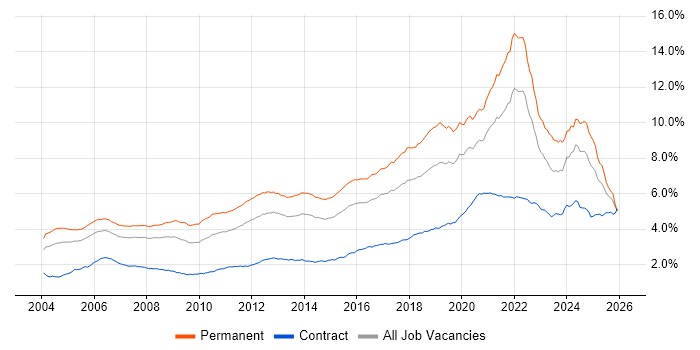
Job Vacancy Trend in England

Job postings citing Software Engineering as a proportion of all IT jobs advertised in England.

Job vacancy trend for Software Engineering in England

Software Engineering
Salary Trend in England

Salary distribution trend for jobs in England citing Software Engineering.

Salary distribution trend for jobs in England citing Software Engineering

Software Engineering
Salary Histogram in England

Salary distribution for jobs citing Software Engineering in England over the 6 months to 18 September 2025.

Salary histogram for Software Engineering in England

Software Engineering
Job Locations in England

The table below looks at the demand and provides a guide to the median salaries quoted in IT jobs citing Software Engineering within the England region over the 6 months to 18 September 2025. The 'Rank Change' column provides an indication of the change in demand within each location based on the same 6 month period last year.

Location Rank Change
on Same Period
Last Year
Matching
Permanent
IT Job Ads
Median Salary
Past 6 Months
Median Salary
% Change
on Same Period
Last Year
Live
Jobs
London -3 1,341 £105,000 +5.00% 758
North of England -20 726 £68,500 +24.55% 404
North West -18 508 £70,000 +17.65% 252
South East -31 449 £70,000 +20.69% 533
South West -15 247 £60,000 - 257
Midlands -47 230 £65,000 +18.18% 267
East of England -37 179 £55,000 -15.38% 221
Yorkshire -23 172 £70,000 +27.27% 121
West Midlands -33 129 £65,000 +8.33% 147
East Midlands -36 103 £65,000 +36.84% 114
North East -14 46 £62,500 +13.64% 35
Software Engineering
UK

Software Engineering
Co-occurring Skills and Capabilities in England by Category

The follow tables expand on the table above by listing co-occurrences grouped by category. The same employment type, locality and period is covered with up to 20 co-occurrences shown in each of the following categories:

Application Platforms
1 219 (6.80%) Apache Airflow
2 141 (4.38%) Confluence
3 103 (3.20%) Apache
4 51 (1.58%) Apache Spark
5 24 (0.75%) Kinematics
6 16 (0.50%) CMS
6 16 (0.50%) IIS
6 16 (0.50%) Microsoft Exchange
7 14 (0.43%) SharePoint
8 5 (0.16%) Appian
8 5 (0.16%) BizTalk Server
8 5 (0.16%) Headless CMS
8 5 (0.16%) Jupyter
8 5 (0.16%) nginx
9 4 (0.12%) Apache Pulsar
9 4 (0.12%) Apache Solr
9 4 (0.12%) Traefik
10 3 (0.093%) Liferay
10 3 (0.093%) TPMS
10 3 (0.093%) WinCC
Applications
1 24 (0.75%) Chatbot
2 23 (0.71%) Microsoft Excel
2 23 (0.71%) Simulink
3 14 (0.43%) Microsoft Office
4 9 (0.28%) Adobe XD
5 8 (0.25%) Sketch
6 4 (0.12%) Autodesk Inventor
6 4 (0.12%) CATIA
6 4 (0.12%) SOLIDWORKS
7 3 (0.093%) Microsoft PowerPoint
7 3 (0.093%) MS Visio
7 3 (0.093%) S-PLUS
8 2 (0.062%) Microsoft Project
9 1 (0.031%) 3ds Max
9 1 (0.031%) AutoCAD
9 1 (0.031%) Blender
9 1 (0.031%) EPLAN
9 1 (0.031%) GNU Octave
9 1 (0.031%) Photoshop
9 1 (0.031%) Trello
Business Applications
1 10 (0.31%) NetSuite
1 10 (0.31%) Payment Gateway
2 9 (0.28%) Shopify
3 8 (0.25%) Dynamics CRM
4 7 (0.22%) Q-Pulse
5 6 (0.19%) Magento
6 4 (0.12%) Sage 200
6 4 (0.12%) Salesforce CRM
7 3 (0.093%) Remedy ITSM
8 2 (0.062%) Endur
9 1 (0.031%) BASE24
9 1 (0.031%) Dynamics NAV
9 1 (0.031%) Eikon
9 1 (0.031%) Oracle BPM
9 1 (0.031%) RMDS
9 1 (0.031%) SAP S/4HANA
9 1 (0.031%) Sparx Enterprise Architect
9 1 (0.031%) Teamcenter
Cloud Services
1 1,446 (44.91%) AWS
2 999 (31.02%) Azure
3 640 (19.88%) GCP
4 202 (6.27%) SaaS
5 197 (6.12%) dbt
6 140 (4.35%) GitHub
7 137 (4.25%) Serverless
8 108 (3.35%) Snowflake
9 104 (3.23%) Amazon EKS
10 98 (3.04%) AWS Lambda
11 80 (2.48%) Amazon S3
12 74 (2.30%) AWS CloudFormation
12 74 (2.30%) Azure DevOps
12 74 (2.30%) GitHub Actions
12 74 (2.30%) Power Platform
13 55 (1.71%) Amazon ECS
14 51 (1.58%) Amazon EC2
15 33 (1.02%) Cloud Computing
16 31 (0.96%) Figma
17 28 (0.87%) Amazon SageMaker
Communications & Networking
1 45 (1.40%) Wireless
2 35 (1.09%) Software-Defined Radio
3 18 (0.56%) DNS
4 17 (0.53%) TCP/IP
5 16 (0.50%) Internet
6 15 (0.47%) Wi-Fi
7 12 (0.37%) Bluetooth
8 11 (0.34%) Firewall
8 11 (0.34%) Multicast
9 10 (0.31%) HTTP
9 10 (0.31%) Network Security
10 9 (0.28%) VPN
10 9 (0.28%) WAN
11 7 (0.22%) Broadband
12 6 (0.19%) Reverse Proxy
13 5 (0.16%) DHCP
13 5 (0.16%) Kerberos
13 5 (0.16%) Modbus
14 4 (0.12%) HTTPS
14 4 (0.12%) ICMP
Database & Business Intelligence
1 322 (10.00%) SQL Server
2 219 (6.80%) PostgreSQL
3 199 (6.18%) Amazon Athena
4 198 (6.15%) Apache Iceberg
5 186 (5.78%) Apache Arrow
5 186 (5.78%) Dremio
6 140 (4.35%) NoSQL
7 110 (3.42%) MongoDB
8 108 (3.35%) Data Lake
9 105 (3.26%) Relational Database
10 89 (2.76%) Apache Ignite
10 89 (2.76%) MySQL
11 70 (2.17%) Elasticsearch
12 66 (2.05%) DynamoDB
13 45 (1.40%) Big Data
14 37 (1.15%) Data Warehouse
15 36 (1.12%) Power BI
16 30 (0.93%) Amazon RDS
17 25 (0.78%) Redis
18 20 (0.62%) KDB
Development Applications
1 281 (8.73%) JIRA
2 265 (8.23%) GitLab
3 230 (7.14%) Selenium
4 222 (6.89%) Maven
5 219 (6.80%) Git
6 216 (6.71%) Cucumber
7 208 (6.46%) Bitbucket
7 208 (6.46%) SonarQube
8 206 (6.40%) Sonatype Nexus
9 92 (2.86%) Jenkins
10 34 (1.06%) JUnit
11 25 (0.78%) Vite
12 21 (0.65%) Cypress.io
13 15 (0.47%) Visual Studio
14 14 (0.43%) TeamCity
15 13 (0.40%) Octopus Deploy
16 12 (0.37%) Spinnaker
16 12 (0.37%) webpack
17 11 (0.34%) Mockito
17 11 (0.34%) Subversion
General
1 1,233 (38.29%) Finance
2 852 (26.46%) Inclusion and Diversity
3 635 (19.72%) Banking
4 560 (17.39%) Social Skills
5 481 (14.94%) Law
6 307 (9.53%) Front Office
7 280 (8.70%) Analytical Skills
8 231 (7.17%) Investment Banking
9 180 (5.59%) Marketing
10 161 (5.00%) Retail
11 94 (2.92%) Aviation
12 90 (2.80%) Corporate Banking
13 85 (2.64%) Public Sector
14 78 (2.42%) Electronics
15 71 (2.20%) Manufacturing
16 65 (2.02%) Legal
17 62 (1.93%) Financial Institution
18 56 (1.74%) Games
19 31 (0.96%) Back Office
20 30 (0.93%) Organisational Skills
Job Titles
1 1,877 (58.29%) Software Engineer
2 848 (26.34%) Senior
3 643 (19.97%) Senior Software Engineer
4 546 (16.96%) Developer
5 515 (15.99%) Lead
6 318 (9.88%) Lead Software Engineer
7 308 (9.57%) Java Engineer
8 302 (9.38%) Python Engineer
9 295 (9.16%) Java Software Engineer
10 285 (8.85%) Python Software Engineer
11 248 (7.70%) AWS Engineer
12 229 (7.11%) AWS Software Engineer
13 165 (5.12%) Developer/Software Engineer
14 146 (4.53%) Software Developer
15 132 (4.10%) Senior Java Engineer
16 125 (3.88%) Senior Java Software Engineer
17 119 (3.70%) Python Developer
18 113 (3.51%) Engineering Manager
19 105 (3.26%) AWS Developer
20 89 (2.76%) Principal Engineer
Libraries, Frameworks & Software Standards
1 780 (24.22%) React
2 597 (18.54%) .NET
3 506 (15.71%) Node.js
4 435 (13.51%) Kafka
5 401 (12.45%) Spring
6 353 (10.96%) Spring Boot
7 314 (9.75%) HTML
8 311 (9.66%) CSS
9 274 (8.51%) Redux
10 256 (7.95%) Pandas
11 250 (7.76%) AngularJS
12 232 (7.20%) RESTful
13 219 (6.80%) REST
14 200 (6.21%) JPA
15 193 (5.99%) NumPy
16 188 (5.84%) SciPy
17 180 (5.59%) Vue
18 138 (4.29%) Jest
19 135 (4.19%) Hibernate
20 122 (3.79%) HTML5
Miscellaneous
1 353 (10.96%) Cloud Native
2 330 (10.25%) Product Ownership
3 266 (8.26%) Cyberattack
4 250 (7.76%) Fixed Income
5 237 (7.36%) Equities
6 233 (7.24%) Foreign Exchange (FX)
7 232 (7.20%) Enterprise Software
8 219 (6.80%) Self-Motivation
9 184 (5.71%) Linux Command Line
10 177 (5.50%) Algorithms
11 176 (5.47%) Distributed Systems
12 145 (4.50%) Derivative
13 117 (3.63%) Robotics
14 115 (3.57%) Hedge funds
15 89 (2.76%) Pricing Data
16 77 (2.39%) Greenfield Project
17 74 (2.30%) Data Structures
18 72 (2.24%) Embedded Systems
18 72 (2.24%) Public Cloud
19 66 (2.05%) Management Information System
Operating Systems
1 416 (12.92%) Linux
2 97 (3.01%) Android
3 47 (1.46%) Windows
4 46 (1.43%) Embedded Linux
5 41 (1.27%) Unix
6 39 (1.21%) Apple iOS
7 19 (0.59%) Windows Server
8 11 (0.34%) Mac OS
9 4 (0.12%) FreeRTOS
10 2 (0.062%) VMS
10 2 (0.062%) zOS
11 1 (0.031%) CentOS
11 1 (0.031%) Debian
11 1 (0.031%) SafeRTOS
11 1 (0.031%) Ubuntu
Processes & Methodologies
1 1,717 (53.32%) Agile
2 953 (29.60%) CI/CD
3 783 (24.32%) Microservices
4 665 (20.65%) DevOps
5 640 (19.88%) SDLC
6 569 (17.67%) Mentoring
7 559 (17.36%) Problem-Solving
8 541 (16.80%) Full-Stack Development
9 528 (16.40%) Artificial Intelligence
10 442 (13.73%) Containerisation
11 440 (13.66%) Machine Learning
12 438 (13.60%) Test Automation
13 400 (12.42%) User Experience
14 388 (12.05%) Continuous Improvement
15 357 (11.09%) Fintech
16 342 (10.62%) TDD
17 337 (10.47%) Computer Science
18 321 (9.97%) Scrum
19 280 (8.70%) Front End Development
20 273 (8.48%) Clean Code
Programming Languages
1 1,183 (36.74%) Java
2 1,128 (35.03%) Python
3 1,044 (32.42%) JavaScript
4 720 (22.36%) TypeScript
5 602 (18.70%) SQL
6 485 (15.06%) C++
7 390 (12.11%) Go
8 381 (11.83%) C#
9 300 (9.32%) Rust
10 162 (5.03%) C
11 89 (2.76%) Kotlin
12 54 (1.68%) Bash
13 35 (1.09%) PHP
14 30 (0.93%) MATLAB
15 28 (0.87%) Scala
16 26 (0.81%) Ruby
17 25 (0.78%) Shell Script
18 22 (0.68%) PowerShell
19 16 (0.50%) Embedded C
20 15 (0.47%) PL/SQL
Qualifications
1 471 (14.63%) Security Cleared
2 411 (12.76%) Degree
3 273 (8.48%) DV Cleared
4 242 (7.52%) AWS Certification
5 206 (6.40%) AWS Certified Solutions Architect
6 191 (5.93%) AWS Certified Developer
7 181 (5.62%) SC Cleared
8 160 (4.97%) Computer Science Degree
9 74 (2.30%) Master's Degree
10 69 (2.14%) HND
11 55 (1.71%) PhD
12 42 (1.30%) BPSS Clearance
13 31 (0.96%) HNC
14 14 (0.43%) Azure Certification
15 11 (0.34%) Chartered Engineer
15 11 (0.34%) Microsoft Certification
16 8 (0.25%) DBS Check
17 5 (0.16%) PMI Certification
17 5 (0.16%) PMP
17 5 (0.16%) TOGAF Certification
Quality Assurance & Compliance
1 332 (10.31%) QA
2 136 (4.22%) Accessibility
3 32 (0.99%) ISO/IEC 27001
4 30 (0.93%) Data Quality
4 30 (0.93%) GDPR
5 14 (0.43%) Cyber Essentials
6 13 (0.40%) WCAG
7 12 (0.37%) ISO/IEC 12207
7 12 (0.37%) PCI DSS
8 11 (0.34%) Cyber Essentials PLUS
9 8 (0.25%) ISO 9001
10 7 (0.22%) HIPAA
10 7 (0.22%) NIST
10 7 (0.22%) SOC 2
11 6 (0.19%) JTAG
12 5 (0.16%) California Consumer Privacy Act
12 5 (0.16%) IEC 61131
12 5 (0.16%) SLA
13 4 (0.12%) PMO
13 4 (0.12%) Software Quality Assurance
System Software
1 566 (17.58%) Docker
2 67 (2.08%) Firmware
3 43 (1.34%) Embedded Firmware
4 20 (0.62%) VMware Infrastructure
5 10 (0.31%) Active Directory
6 5 (0.16%) Virtual Machines
6 5 (0.16%) zsh
7 3 (0.093%) Apache Flume
7 3 (0.093%) HDFS
8 2 (0.062%) Hyper-V
8 2 (0.062%) Virtual Servers
9 1 (0.031%) Slurm Workload Manager
Systems Management
1 693 (21.52%) Kubernetes
2 268 (8.32%) Terraform
3 97 (3.01%) Ansible
4 39 (1.21%) Prometheus
5 38 (1.18%) Grafana
6 14 (0.43%) Argo
6 14 (0.43%) Single Sign-On
7 12 (0.37%) Kibana
8 8 (0.25%) Istio
8 8 (0.25%) Mesos
9 7 (0.22%) Progress Chef
10 6 (0.19%) ArcSight ESM
10 6 (0.19%) Jamf Pro
10 6 (0.19%) Puppet
10 6 (0.19%) QRadar
11 5 (0.16%) Kubeflow
12 4 (0.12%) HAProxy
12 4 (0.12%) Salt
13 3 (0.093%) logstash
13 3 (0.093%) Oozie
Vendors
1 198 (6.15%) Solace
2 195 (6.06%) Microsoft
3 84 (2.61%) Google
4 72 (2.24%) Databricks
5 65 (2.02%) Oracle
6 22 (0.68%) Splunk
7 21 (0.65%) Siemens
7 21 (0.65%) VMware
8 20 (0.62%) SAP
9 19 (0.59%) Salesforce
9 19 (0.59%) ServiceNow
10 17 (0.53%) Guidewire
10 17 (0.53%) IBM
10 17 (0.53%) MuleSoft
10 17 (0.53%) OpenAI
11 16 (0.50%) Ping Identity
11 16 (0.50%) Sage
12 13 (0.40%) Informatica
13 12 (0.37%) Adobe
14 11 (0.34%) Foundry