Sparx Jobs with Work from Home Options

Sparx
UK > Work from Home

The table below provides summary statistics for permanent job vacancies with an option to work from home (WFH) and a requirement for knowledge and experience of Sparx products and/or services. Included is a benchmarking guide to the salaries offered in vacancies that have cited Sparx over the 6 months to 9 May 2024 with a comparison to the same period in the previous 2 years.

The figures below represent the IT labour market in general and are not representative of salaries within Sparx Systems.

6 months to
9 May 2024
Same period 2023 Same period 2022
Rank 528 639 796
Rank change year-on-year +111 +157 -257
Permanent jobs citing Sparx 61 22 46
As % of all permanent jobs with a WFH option 0.18% 0.053% 0.067%
As % of the Vendors category 0.44% 0.13% 0.18%
Number of salaries quoted 14 8 37
10th Percentile - £53,125 £44,111
25th Percentile £61,250 £55,000 £70,000
Median annual salary (50th Percentile) £72,750 £59,000 £76,000
Median % change year-on-year +23.31% -22.37% +12.59%
75th Percentile £95,050 £65,250 £97,500
90th Percentile £101,250 £82,500 -
UK median annual salary £65,000 £56,000 £76,000
% change year-on-year +16.07% -26.32% +8.57%

All Vendors
Work from Home

Sparx is in the Vendor Products and Services category. The following table is for comparison with the above and provides summary statistics for all permanent job vacancies with a WFH option and a requirement for knowledge or experience of vendor products and services.

Permanent vacancies with a requirement for knowledge or experience of vendor products and services 13,996 16,844 25,336
As % of all permanent jobs with a WFH option 41.45% 40.61% 37.01%
Number of salaries quoted 9,966 11,211 15,051
10th Percentile £31,250 £32,860 £32,500
25th Percentile £41,250 £43,750 £42,500
Median annual salary (50th Percentile) £55,000 £59,000 £57,500
Median % change year-on-year -6.78% +2.61% +4.55%
75th Percentile £71,250 £77,500 £77,500
90th Percentile £87,500 £93,750 £92,500
UK median annual salary £50,000 £57,500 £55,000
% change year-on-year -13.04% +4.55% +4.76%

Sparx
Trend for Jobs with a WFH Option

Job vacancies with a work from home option citing Sparx as a proportion of all IT jobs advertised.
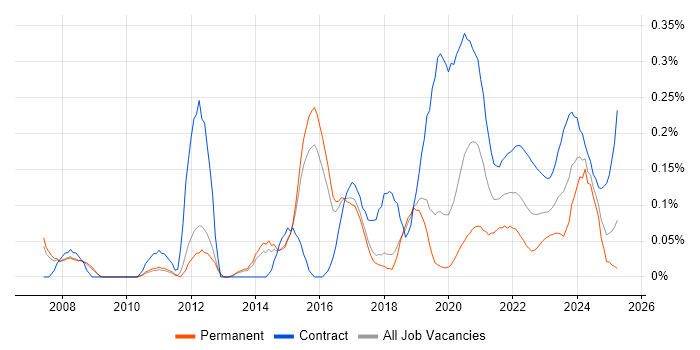
Sparx trend for jobs with a WFH option

Sparx
Salary Trend for Jobs with a WFH Option

3-month moving average salary quoted in job vacancies with a work from home option citing Sparx.

Sparx salary trend for jobs with a WFH option

Sparx
Salary Histogram for Jobs with a WFH Option

Salary distribution for jobs with a work from home option citing Sparx over the 6 months to 9 May 2024.

Sparx salary histogram for jobs with a WFH option

Sparx
Co-occurring Skills and Capabilities with WFH Options by Category

The follow tables expand on the table above by listing co-occurrences grouped by category. The same employment type, locality and period is covered with up to 20 co-occurrences shown in each of the following categories:

Application Platforms
1 46 (75.41%) WebLogic
2 4 (6.56%) ArcGIS
3 1 (1.64%) Apache
Applications
1 4 (6.56%) MS Visio
Business Applications
1 60 (98.36%) Sparx Enterprise Architect
Cloud Services
1 54 (88.52%) Azure
2 48 (78.69%) AWS
3 46 (75.41%) Amazon EKS
3 46 (75.41%) Amazon SQS
4 7 (11.48%) IaaS
4 7 (11.48%) PaaS
5 4 (6.56%) Microsoft 365
6 3 (4.92%) Cloud Computing
6 3 (4.92%) Lucidchart
6 3 (4.92%) SaaS
6 3 (4.92%) Serverless
7 1 (1.64%) Azure Data Factory
7 1 (1.64%) Azure Synapse Analytics
7 1 (1.64%) Power Platform
Communications & Networking
1 46 (75.41%) BGP
1 46 (75.41%) DNS
1 46 (75.41%) SSL
1 46 (75.41%) TCP/IP
2 3 (4.92%) Internet
3 2 (3.28%) 4G
3 2 (3.28%) 5G
3 2 (3.28%) Network Security
3 2 (3.28%) VoIP
Database & Business Intelligence
1 46 (75.41%) Amazon RDS
1 46 (75.41%) Oracle Database
1 46 (75.41%) RDBMS
1 46 (75.41%) Relational Database
2 4 (6.56%) Big Data
2 4 (6.56%) Geospatial Data
2 4 (6.56%) GIS
2 4 (6.56%) NoSQL
3 2 (3.28%) Metadata
4 1 (1.64%) Data Lake
4 1 (1.64%) Power BI
4 1 (1.64%) SQL Server
4 1 (1.64%) SQL Server Analysis Services
4 1 (1.64%) SQL Server Integration Services
Development Applications
1 1 (1.64%) Rational DOORS
General
1 47 (77.05%) Social Skills
2 5 (8.20%) Public Sector
3 3 (4.92%) Aerospace
3 3 (4.92%) Inclusion and Diversity
4 2 (3.28%) Finance
4 2 (3.28%) Public Speaking
5 1 (1.64%) Analytical Skills
5 1 (1.64%) Billing
5 1 (1.64%) Military
5 1 (1.64%) Pharmaceutical
5 1 (1.64%) Telecoms
Job Titles
1 58 (95.08%) Architect
2 55 (90.16%) Solutions Architect
3 46 (75.41%) Lead
3 46 (75.41%) Lead Architect
3 46 (75.41%) Lead Solutions Architect
4 5 (8.20%) IT Architect
5 3 (4.92%) Cloud Architect
5 3 (4.92%) Systems Engineer
6 2 (3.28%) Azure Architect
6 2 (3.28%) Cloud Solutions Architect
6 2 (3.28%) IT Engineer
6 2 (3.28%) Network Communications Engineer
6 2 (3.28%) Network Systems Engineer
6 2 (3.28%) ServiceNow Architect
6 2 (3.28%) Technical Architect
6 2 (3.28%) Technical Solutions Architect
7 1 (1.64%) Requirements Architect
7 1 (1.64%) Requirements Engineer
7 1 (1.64%) Senior
7 1 (1.64%) Systems Architect
Libraries, Frameworks & Software Standards
1 46 (75.41%) RabbitMQ
1 46 (75.41%) Spring Boot
2 4 (6.56%) .NET
3 2 (3.28%) REST
3 2 (3.28%) SOAP
Miscellaneous
1 46 (75.41%) Enterprise Software
1 46 (75.41%) Public Cloud
2 4 (6.56%) Management Information System
3 3 (4.92%) Cloud Native
3 3 (4.92%) Mobile App
4 2 (3.28%) CMDB
4 2 (3.28%) N-Tier
4 2 (3.28%) Product Ownership
5 1 (1.64%) Algorithms
5 1 (1.64%) Operational Technology
5 1 (1.64%) Reference Data
5 1 (1.64%) SCADA
Operating Systems
1 48 (78.69%) Linux
2 46 (75.41%) Red Hat Enterprise Linux
3 5 (8.20%) Windows
Processes & Methodologies
1 58 (95.08%) TOGAF
2 56 (91.80%) Agile
3 52 (85.25%) ArchiMate
4 49 (80.33%) Scrum
4 49 (80.33%) Systems Engineering
5 48 (78.69%) Project Management
5 48 (78.69%) SDLC
6 46 (75.41%) Actionable Insight
6 46 (75.41%) Cloud Operations
6 46 (75.41%) Collaborative Working
6 46 (75.41%) Data Migration
6 46 (75.41%) Kanban
6 46 (75.41%) Load Balancing
6 46 (75.41%) Migration
6 46 (75.41%) Open Source
6 46 (75.41%) Re-Platforming
7 8 (13.11%) Analytics
8 6 (9.84%) DevOps
8 6 (9.84%) Enterprise Architecture
8 6 (9.84%) UML
Programming Languages
1 4 (6.56%) SQL
Qualifications
1 56 (91.80%) Security Cleared
2 55 (90.16%) SC Cleared
3 49 (80.33%) Azure Certification
4 48 (78.69%) AWS Certification
5 46 (75.41%) AWS Certified Solutions Architect
6 5 (8.20%) Degree
7 4 (6.56%) TOGAF Certification
8 1 (1.64%) Chartered Engineer
8 1 (1.64%) Computer Science Degree
8 1 (1.64%) Master's Degree
Quality Assurance & Compliance
1 1 (1.64%) Data Quality
1 1 (1.64%) Def Stans
1 1 (1.64%) IEC 61508
System Software
1 3 (4.92%) VMware Infrastructure
Systems Management
1 1 (1.64%) Terraform
Vendors
1 46 (75.41%) Oracle
2 5 (8.20%) Microsoft
3 4 (6.56%) ESRI
4 3 (4.92%) SAP
4 3 (4.92%) VMware
5 2 (3.28%) ServiceNow
6 1 (1.64%) BiZZdesign
6 1 (1.64%) Databricks
6 1 (1.64%) EMC